Mailchimp
Not subscribed to OpsMatters Newsletter


AWS Fargate is a serverless compute engine that allows you to deploy containerized applications on services like Amazon ECS without needing to provision or manage compute resources. Now, Datadog is proud to be a launch partner with Amazon for their support of AWS Fargate workloads running on Graviton2, Amazon’s proprietary ARM64 processor.
The past two years have been challenging on many fronts for people and businesses alike. As a global community, we have been unable to travel long distances due to various restrictions, but that doesn’t mean we stop reaching for the stars.
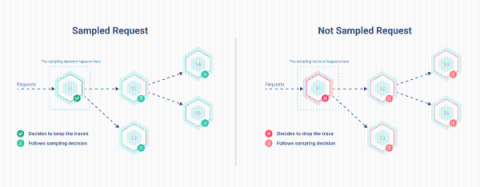
Today we are introducing Local Tail-Based sampling in Kamon Telemetry! We are going to tell you all about it in a little bit but before that, let’s take a couple minutes to explore what is sampling, how it is used nowadays, and what motivated us to including local tail sampling in Kamon Telemetry.
We can now notify you of changing DNS records and let you know when we've detected a problem with your domain nameservers. Woohoo! 🥳
Video cameras are gaining more and more applications every year. Besides the security issues, a lot of others, related to house and family care, entertainment, education etc are widely used nowadays.
Application Performance Monitoring is undoubtedly the hottest tool to accelerate any product’s growth in the modern market. The term has grown from a simple performance tracking operation to full-fledged infrastructure, network, and application observability. This evolution has only helped bring more and more growth into products. It is essential to choose the best-suited monitoring solution for your apps since observability involves way too many moving pieces.