Operations | Monitoring | ITSM | DevOps | Cloud

Tracing

The latest News and Information on Distributed Tracing and related technologies.

Monitoring your Express application using OpenTelemetry

Nodejs is a popular Javascript runtime environment that executes Javascript code outside of a web browser. Express is the most popular web frameworks that sits on top of Nodejs and adds functionalities like middleware, routing, etc. to Nodejs. You can monitor your express application using OpenTelemetry and a tracing backend of your choice.

Monitoring your Nextjs application using OpenTelemetry

Nextjs is a production-ready React framework for building single-page web applications. It enables you to build fast and user-friendly static websites, as well as web applications using Reactjs. Using OpenTelemetry Nextjs libraries, you can set up end-to-end tracing for your Nextjs applications. Nextjs has its own monitoring feature, but it is only limited to measuring the metrics like core web vitals and real-time analytics of the application.

Cribl Stream: Up To 47x More Efficient vs OpenTelemetry Collector

Let me set the record straight before anyone accuses me of bias or not being an OpenTelemetry supporter. Cribl loves OpenTelemetry! We’ve written lots of blogs about It; we have vendor-specific OpenTelemetry Destinations (with more to come!), and we support automatic batch parsing for easier data manipulation and re-batching for network transport efficiency of logs, metrics, and traces.

12 Ways We Sleighed Innovation This Year

As we wrap up an incredible year, it’s the perfect time to celebrate Cribl’s progress and innovation in 2024! This year brought many exciting features designed to solve real-world problems and make life easier for our customers. In the spirit of reflection and festivity, I’ll highlight twelve game-changing product features, releases, and enhancements— each a testament to listening, learning, and delivering value to you, our users.

Introduction to the OpenTelemetry Sum Connector

When you have a piece of data tucked into your logs or span tags, how do you dig for that bounty of insight today? Commonly this sort of data will be numeric, like a purchase total or number of units. Wouldn’t it be nice to easily turn that data into a metric timeseries? The Sum Connector in OpenTelemetry does just that, allowing you to create sums from attributes attached to logs, spans, span events, and even data points!

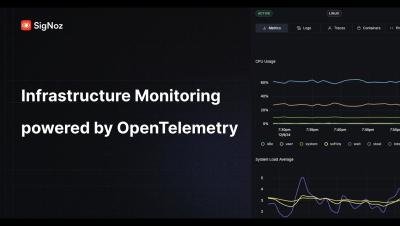
Out of box Infrastructure Monitoring native to OpenTelemetry

Infrastructure monitoring module based on OpenTelemetry This is our first release with infra monitoring module and we have added support for: In roadmap If you need any clarification or find something missing, feel free to raise a GitHub issue with the label documentation or reach out to us at the community slack channel.

Implementing OpenTelemetry in Angular - A Practical Guide

Angular applications often grow in complexity, making it challenging to monitor performance and troubleshoot issues effectively. Enter OpenTelemetry: a powerful, vendor-neutral framework for telemetry collection. This guide will walk you through implementing OpenTelemetry in your Angular projects, enhancing your ability to observe and optimize your applications.

Simplify OpenTelemetry Metrics with Cribl Edge OTLP Conversion

Cribl Edge can send data to OpenTelemetry in several different ways. In this blog post, we’ll focus on the OpenTelemetry Metrics. In the blog, we’ll talk about Cribl Edge, but what we say applies to Cribl Stream, too! We will cover how to use Cribl Edge to collect Linux System Metrics, transform them into the OTLP Metrics format, and deliver them to an OTLP Destination.