Operations | Monitoring | ITSM | DevOps | Cloud

Tracing

The latest News and Information on Distributed Tracing and related technologies.

OpenTelemetry Processors: Workflows, Configuration Tips, and Best Practices

Most developers are familiar with Opentelemetry core components—Traces, Metrics, and Logs. But there’s one part of the OpenTelemetry ecosystem that doesn’t always get the spotlight: processors. These behind-the-scenes operators shape your data pipeline, helping you filter, enrich, and fine-tune telemetry data before it reaches your backend systems. Processors play a key role in making sure your data is cleaner, more useful, and just the way you need it.

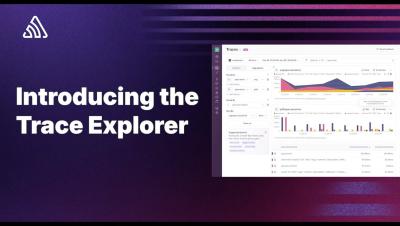
Introducing the Sentry Trace Explorer

The Trace Explorer is a new way to query and visualize the application metrics from the traces and spans within your applications. In this video, Cody from the Sentry Developer Experience team shows you how you can get started using it. Want to dive in and find your slow database queries, or what pages or components are loading the slowest? Trace Explorer is the best way to do it - and gives you an easy path to jumping into the spans that make up all actions within your application.

OpenMetrics vs OpenTelemetry: A Detailed Comparison

When it comes to monitoring and observability, two of the most discussed standards are OpenMetrics and OpenTelemetry. While both are designed to collect and transmit metrics, they have distinct goals, use cases, and communities driving their development. In this guide, we'll break down what each of these projects is, how they compare, and how they fit into your monitoring stack.

An Easy Guide to OpenTelemetry Environment Variables

When working with OpenTelemetry, environment variables play a crucial role in configuring and customizing your setup. These variables provide a flexible and convenient way to adjust settings without needing to change code, allowing you to fine-tune your OpenTelemetry installation across different environments.

OpenTelemetry Collector with Docker: A Detailed Guide

Monitoring and observability have become the backbone of reliable software systems. OpenTelemetry, a CNCF project, has gained immense traction as the go-to framework for collecting and exporting telemetry data. But what makes it even more powerful is its Collector—a vendor-agnostic tool that simplifies data processing. Combine that with Docker, and you’ve got a robust, portable, and scalable observability solution.

DX Operational Observability: Onboarding OpenTelemetry in Minutes

In our era of cloud-native applications, robust observability is critical to maintain performance, identify issues, and enhance user experiences. With its advanced capabilities, DX Operational Observability (DX O2) integrates seamlessly with OpenTelemetry, a leading open-source observability framework. In this blog, we explore how to onboard the OpenTelemetry Demo Application to DX O2. The demo application provides a hands-on introduction to combining these powerful tools.

OpenTelemetry Profiling: A Look into Performance Insights

In software development, making sure your apps perform well is key. Performance issues, hidden delays, and wasted resources can quickly hurt user experience and increase costs. That’s where OpenTelemetry profiling steps in to help. In this blog, we’ll break down what OpenTelemetry profiling is, why it’s important, and how you can use it to optimize your applications.

Getting Started with the OpenTelemetry Helm Chart in K8s

Managing observability in cloud-native environments can feel like juggling a thousand things at once. OpenTelemetry makes this easier by becoming a favorite among developers for collecting, processing, and exporting telemetry data without breaking a sweat. Now, let’s talk about the OpenTelemetry Helm Chart. It’s like having a shortcut button for deploying OpenTelemetry in Kubernetes.