Tutorial: Set up an NGINX for Kubernetes Sources
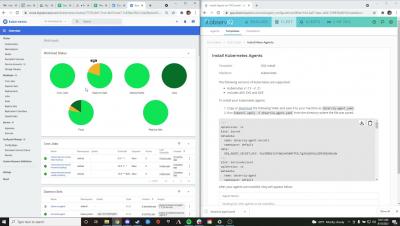
This tutorial helps first-time users on how to set up an NGINX source in the Kubernetes environment easily. Learn how to analyze NGINX performance, monitor complex transactions, track usage patterns, and track key logs and metrics, using the NGINX for Kubernetes sources.