Operations | Monitoring | ITSM | DevOps | Cloud

Blog

Minimising latency in your edge cloud with real-time kernel

From applications in telecommunications to edge cloud and industrial digital twins, experimenting with real-time capabilities in cloud technologies is a trend in the industry. Applications for the edge often have an additional requirement as they interact with real-time systems: they need to run deterministically. It means that time constraints their execution and interaction within the system.

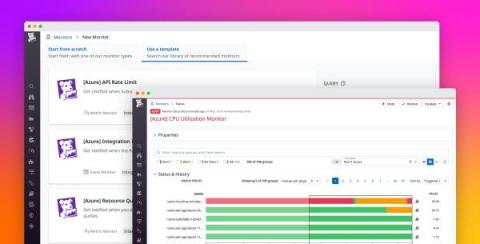
Enable preconfigured alerts with Recommended Monitors for Azure

As a new Datadog customer, your top priority is figuring out how to maximize the platform’s potential and deliver value to your organization quickly and seamlessly. But with a plethora of options and configurations available at your disposal, it can be overwhelming to determine where to begin. With Datadog, you don’t need to be an expert in observability or monitoring to get up and running efficiently.

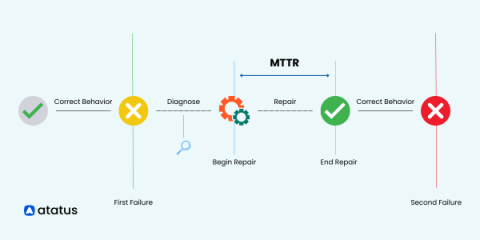
What is MTTR? Calculation and Reduction Strategies

In the fast-paced world of software development, every minute counts. When disruptions occur, whether there are minor or major system failures, organizations need to bounce back to maintain seamless operations. That's where MTTR (Mean Time to Repair) steps onto the stage as a game-changing metric. Are you ready to unlock the secrets behind reducing downtime, boosting performance, and ensuring software reliability?

Optimize your frontend monitoring strategy with Datadog Synthetic Monitoring and RUM

Testing enables you to proactively identify and resolve issues before they break critical functionality in your application, which is essential to ensuring an optimized user experience (UX). However, if you don’t know how users are actually interacting with your application, key user journeys may go untested. This lack of visibility can lead to a proliferation of unoptimized features in your UI, causing users to drop off before completing important actions.

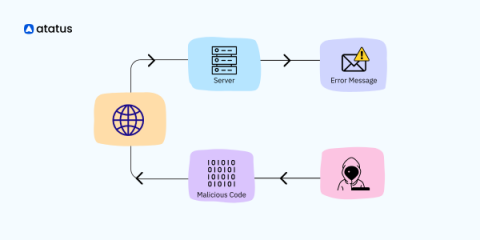
10 Most Common PHP Security Threats and the Best Ways to Fix Them

PHP is a powerful language used by at least 80% of all the applications you use today as their backend scripting language. This can be attributed to its relatively simpler syntax, which is on the same line as other C-style languages. It supports different operating systems (Windows, Linux, macOS), web servers, databases and integrates seamlessly with popular databases like MySQL, PostgreSQL, and Oracle, making it a suitable choice for database-driven applications.

Run container-optimized EKS clusters with Ocean and Bottlerocket OS

AWS is one of the primary providers for services that help users deploy and manage their containerized applications in the cloud. Since launching ECS in 2014 and EKS in 2017, AWS has learned a lot about running containers at scale and in production. In 2020, AWS developed Bottlerocket OS, a new operating system for hosting containers. This OS was specifically designed to address gaps left by the ECS and EKS-optimized AMIs, which are based on operating systems that run traditional software applications.

10 Best Internal Developer Platforms to Consider in 2023

Internal Developer Platforms have emerged as essential tools for streamlining processes and boosting productivity. As we find ourselves in the midst of 2023, the demand for robust developer platforms remains on the rise as organizations strive to find efficient solutions that expedite software delivery.

Coralogix's Cross-Vendor Compatibility To Keep Your Workflow Smooth

Coralogix supports logs, metrics, traces and security data, but some organizations need a multi-vendor strategy to achieve their observability goals, whether it’s developer adoption, or vendor lock-in is preventing them from migrating all of their data. Coralogix offers a set of features that allow customers to bring all of their data into a single flow—across SaaS and hosted solutions.

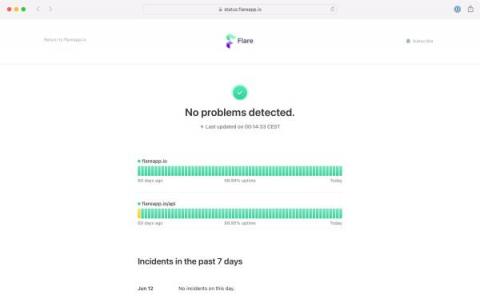
Our redesigned status pages can now show uptime history

Next to the many checks we can perform, we can also render beautiful status pages to inform your audience about the health of your service. Today, we've deployed a redesign of these status pages. In this iteration, everything is more polished. We picked a new font and colors and added some icons to make the status page a bit more visually interesting. In addition to the cosmetic upgrade, we also added a significant new feature. We can now display 60 days of uptime history for your sites.

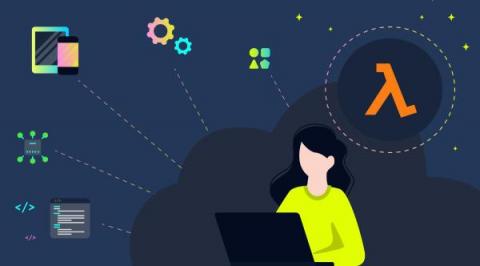
Serverless observability, monitoring, and debugging - Overview and best practices

Serverless, as you may already know, is a cloud computing model where the cloud provider dynamically manages and allocates resources to execute code without the need for server provisioning or infrastructure management on the developer. This article overviews serverless observability, monitoring, and debugging, based on distributed tracing and OpenTelemetry (OTel).