Operations | Monitoring | ITSM | DevOps | Cloud

Blog

Five Things Your APM Platform Should do for Your Container Application Deployments.

One of the chief complexities in running large scale containerized applications is the need for continuous systems/application monitoring. Containers are very different from traditional VMs and the 3 tier applications that run on them. Monitoring that needs to ensure that SLAs promised to the business are being met as well as an ability to forecast usage trends while identifying problem areas such as bugs, capacity challenges, slowing performance, and any potential downtime.

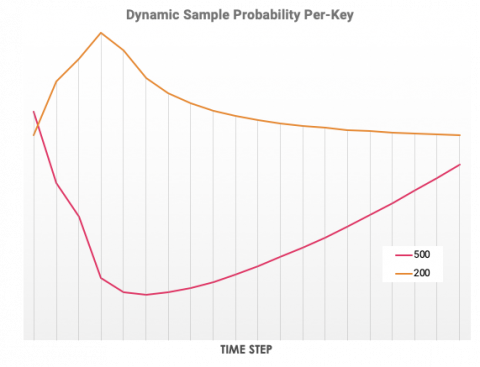
Dynamic Sampling by Example

Last week, Rachel published a guide describing the advantages of dynamic sampling. In it, we discussed varying sample rates to achieve a target collection rate overall, and having different sample rates for distinct kinds of keys. We also teased the idea of combining the two techniques to preserve the most important events and traces for debugging without drowning them out in a sea of noise.

Why Your Lambda Functions May Be Doomed To Fail

AWS Lambda has a cool feature that can be both a blessing and a nightmare for a serverless application, depending on whether it’s properly handled by our code: the retry behavior. A retry occurs when an invocation of a Lambda function results in an error and the AWS Lambda platform automatically invokes the function again, with the same event payload. Before we get deeper, make sure you are familiar with the AWS documentation on the subject.

Alert escalation - How it works in SIGNL4

Part of any managers role is to make sure their team is taking accountability. Managers are not the front lines resolvers that handle issues, that is what they have a team for. However, managers do need to be aware of incidents that are occurring as well as making sure their team is taking ownership and resolving those issues. SIGNL4 takes the managerial work out of being a manager by providing alert ownership transparency.

Firefox add-on outage: Yet another reminder for companies to enforce PKI life cycle automation

More often than we’d like to admit, we tend to underestimate the impact of every moving part within an organization—especially those that seem small or insignificant. And usually, it’s not until we’re facing the fallout of neglecting that seemingly insignificant factor when we realize what a mistake we’ve made.

Worth a Look: Public Grafana Dashboards

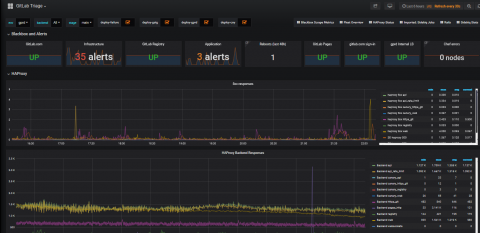
There are countless Grafana dashboards that will only ever be seen internally. But there are also a number of large organizations that have made their dashboards public for a variety of uses. These dashboards can be interesting to browse, giving you an insider’s peek into how real Grafana users set up their visualizations, with actual live data to boot. Perhaps some of them will inspire you to get to work on your own Grafana?