Operations | Monitoring | ITSM | DevOps | Cloud

Grafana ObservabilityCON 2022 Keynote

Live from New York, it’s Grafana ObservabilityCON! Join CEO/Co-founder Raj Dutt, VP of Technology Tom Wilkie, and members of the Grafana Labs engineering team for a look at the latest developments in the open and composable LGTM (Loki-Grafana-Tempo-Mimir) observability stack. Spoiler alert: There will be some exciting announcements!
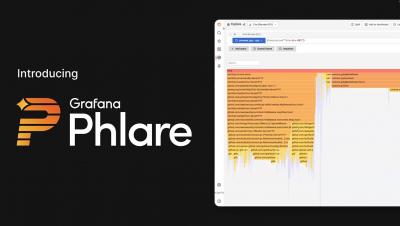
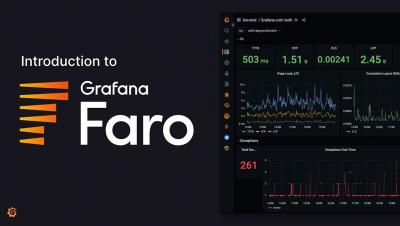
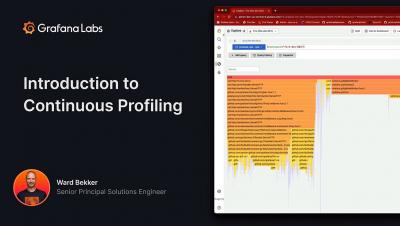
Introduction to continuous profiling

In this video, we will review the advantages of continuous profiling, the difference between continuous profiling vs. traditional profiling, and how continuous profiling can fit into your overall observability strategy. You’ll also learn more about Grafana Phlare, the new open source continuous profiling database, and get a look at the latest flame graph visualization in Grafana.

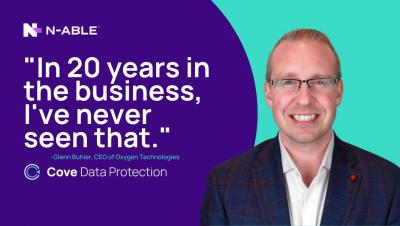
CEO explains how Cove Data Protection exceeded his expectations

When Glen Buhler, CEO of Oxygen Technologies received the business case for Cove Data Protection, he could hardly believe it. He was even more shocked when his team implemented it, and exceeded his expectations. List to Glen explain how Cove Data Protection as a choice for backup is saving his company up to $250,000 a year and lots, and lots of time.

Monitoring MongoDB performance metrics (WiredTiger)

This post is part 1 of a 3-part series about monitoring MongoDB performance with the WiredTiger storage engine. Part 2 explains the different ways to collect MongoDB metrics, and Part 3 details how to monitor its performance with Datadog. If you are using the MMAPv1 storage engine, visit the companion article “Monitoring MongoDB performance metrics (MMAP)”.