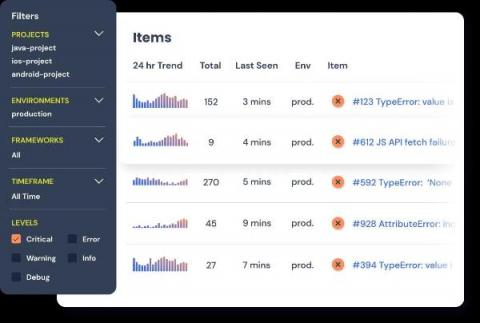
Sentry is a monitoring platform that allows developers to track errors and performance data. In this tutorial, we’ll show you how to add Sentry to a Django application so that you can track and resolve any errors or performance issues that occur while your application is in production.
The explosive growth of ecommerce has slowed in the last year. But the need for businesses to deliver a great digital user experience continues to grow. Companies that don’t rely on online customer purchases can still suffer blows to revenues due to a poor online experience. Market conditions are raising the importance of Application Performance Monitoring (APM) tools to ensure every digital interaction with your company is positive. APM tools vary by design, features and functionality.
We’ve recently completed a large beta test for our new product here at Testmo. We build a test management tool, so most of our users are professional software testers. As you can imagine, our customers are a rather critical group of users when it comes to software quality. We’ve learned some important lessons about running a large beta test and we want to share how we benefited from Sentry error reporting to identify, find, and fix issues quickly.
Errors are the necessary evils of software development. They bring to your attention critical information about what’s wrong with your application and what needs fixing before your end-users suffer. Error monitoring tools offer significant help in this cause by aggregating all the errors and issues your applications (and their end users) are struggling with under one roof and providing valuable insights to resolve these and optimize performance.
Large-scale software projects don't care how many unit tests you put into your code. Or how sophisticated your CI/CD pipeline is. Or how robustly you run blue-green deployments to ease into newly-deployed code. These projects will inevitably find themselves subjected to your users, who will uncover bugs your team didn't catch and didn't even think to test for.
Are you familiar with the four golden signals of Site Reliability Engineering (SRE): latency, traffic, errors, and saturation? Whether you’re a developer or an operator, you’ve likely been responsible for collecting, storing, or analyzing the data associated with these concepts. Much of this data is captured in application and infrastructure logs, which provide a rich history of what is happening behind the scenes in your workloads.
In cases, when a crash happens in your Android application, you want more context on what occured before the issue — kind of like following breadcrumbs to the exception. Our SDKs automatically report breadcrumbs for activity lifecycle events, system events, HTTP requests, and many more. Now, Android developers will also see UI events listed as breadcrumbs and get the full picture of what happened without ever having to recreate the issue.