Operations | Monitoring | ITSM | DevOps | Cloud

Dashboards

Case Study: Building an Operations Dashboard

Picture a simple E-commerce platform with the following components, each generating logs and metrics. Imagine now the on-call Engineer responsible for this platform, feet up on a Sunday morning watching The Lord of The Rings with a coffee, when suddenly the on-call phone starts to ring! Oh no! It’s a customer phoning, and they report that sometimes, maybe a tenth of the time, the web front end is returning a generic error as they try to complete a workflow.

Dashboard Fridays: Sample AWS dashboards

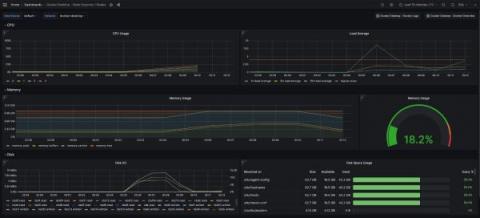
Join Adam Kinniburgh and Dan Watts as they showcase these out-of-the-box AWS dashboards, which are instantly loaded up in your SquaredUp environment when you connect to AWS. These SquaredUp AWS dashboards allow engineers to have a better understanding of their AWS environments immediately, with the possibility of adding metrics from other sources to support the environment view. Stay tuned to see a walkthrough of each dashboard, and understand the challenges they solve.

Easily monitor Docker Desktop containers with Grafana Cloud

18 million — that’s the number of developers around the world who use Docker, the popular tool for containerization. Docker Desktop, a software application for Mac, Windows, and Linux, is one of the most widely used tools within the Docker ecosystem, especially among developers who want to build, test, and deploy applications in containers on their local machines.

Continuous profiling now in public preview in Grafana Cloud

When we announced that Pyroscope was joining Grafana Labs back in March, we expressed our excitement that uniting the Pyroscope and Phlare open source projects and teams would accelerate our plan to add continuous profiling to Grafana Cloud. Just two and a half months later, that day has come! We are proud to announce that Grafana Cloud Profiles is now available in public preview for all Grafana Cloud users, both paid and free.

Introducing powerful APIs and webhooks for Grafana Incident

Grafana Incident, Grafana’s powerful incident response tool, comes with a range of integrations out of the box, including Zoom and Google Meet spaces, GitHub and JIRA issues, and even a Google Doc template for post-incident review documents. However, every team has unique needs and workflows, and you may need to integrate with other systems not currently on our roadmap or even use your own in-house tools.

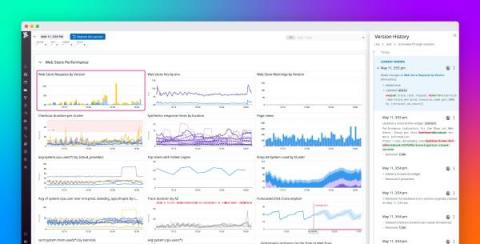
Track changes to Datadog dashboards and notebooks with version history

Datadog dashboards and notebooks can be powerful tools for troubleshooting, enabling you to analyze telemetry from across your stack with visualizations customized by service owners, data analysts, and engineers. Many organizations also rely on dashboards and notebooks for key business processes, such as generating reports, creating postmortems, and managing SLOs. This makes it important to keep track of any unintended changes that may result from others accessing your content.