Operations | Monitoring | ITSM | DevOps | Cloud

Dashboards

A User Guide for OpenSearch Dashboards

Over the last decade, log management has been largely dominated by the ELK Stack – a once-open source tool set that collects, processes, stores and analyzes log data. The ‘k’ in the ELK Stack represents Kibana, which is the component engineers use to query and visualize their log data stored in Elasticsearch. Sadly, in January 2021, Elastic decided to close source the ELK Stack, and as a result, OpenSearch was launched by AWS as an open source replacement.

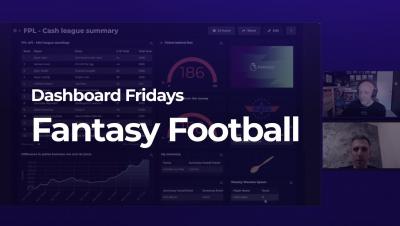
Dashboard Fridays: Fantasy Premier League Football Dashboard with Web API

This Fantasy Football dashboard shows the Cash League (league with cash prizes) and Tim's performance in it, so he can always see where he is in relation to first place. Tim decided it was time to put SquaredUp to work on his personal passion and build a dashboard that allows him to consume the information at a glance. All the data is pulled from the FPL Web API and includes monitoring to get the colors to show whether he's doing well or not.

Icinga Kubernetes Helm Charts

Before attending Icinga Berlin in May this year, Daniel Bodky and Markus Opolka from our partner NETWAYS developed the very first Icinga Kubernetes Helm Charts and released it in an alpha version. If you have ever wanted to deploy an entire Icinga stack in your Kubernetes cluster, now is your chance. I also want to highlight Daniel’s talk again on how Icinga can run on Kubernetes and the challenges involved.

GrafanaCON 2023 keynote: Grafana 10, cool new dashboards, and more

The keynote at GrafanaCON 2023 streamed live from Stockholm and kicked off two days of sessions on the latest Grafana 10 release as well as success stories and interesting use cases from the community. You can watch all the GrafanaCON sessions online. For more about Grafana 10, read the Grafana 10 release blog. You can explore all the new features in Grafana 10 by upgrading your instance or downloading Grafana 10 today.

Azure Integration with Graphite and Grafana

In this article, we will see how we can integrate an Azure data source with Graphite and Grafana. This will allow us to monitor metrics from the applications hosted in the Azure cloud on a Grafana dashboard. We will also see how to integrate Azure Active Directory with MetricFire’s Hosted Graphite and Grafana. You don’t need fully functional cloud services running with Azure to understand this article, but it assumes that you have basic familiarity with Azure Cloud.

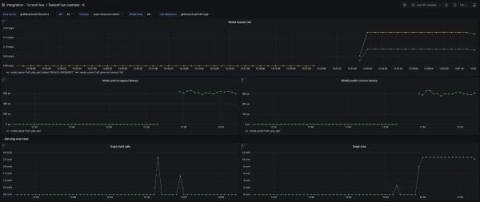
How to observe your TensorFlow Serving instances with Grafana Cloud

The world of AI and machine learning has evolved at an accelerated pace these past few years, and the advent of ChatGPT, DALL-E, and Stable Diffusion has brought a lot of additional attention to the topic. Being aware of this, Grafana Labs prepared an integration for monitoring one of the most used machine learning model servers available: TensorFlow Serving. TensorFlow Serving is an open source, flexible serving system built to support the use of machine learning models at scale.

How many metrics? A guide to estimating the size of your system in Grafana Cloud

Grafana Cloud, our composable observability platform, is billed based on usage. A common question we get is: “How much will it cost to monitor N servers?” Well, the recently expanded Grafana Cloud Free tier includes up to 10,000 active series. To help you understand what that translates to in terms of time series requirements, here’s a rough guide to estimating what you’ll need.

Celebrating Grafana 10: Torkel's top 10 moments from a decade of dashboarding

Grafana creator Torkel Ödegaard will never forget the very first GrafanaCON in 2015, when he shared some big news with the audience gathered in New York City. “I’ll always remember standing on stage and announcing that we just reached 12,000 instances and being super proud because it was just a couple of months after we started tracking these numbers,” says Torkel, who also launched Grafana Labs with co-founders Raj Dutt and Anthony Woods in 2014.