Operations | Monitoring | ITSM | DevOps | Cloud

Dashboards

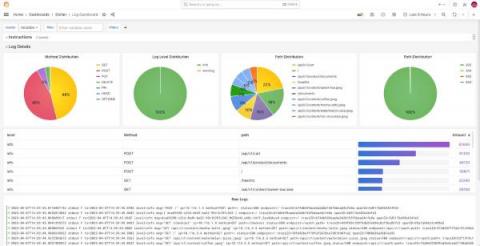
6 easy ways to improve your log dashboards with Grafana and Grafana Loki

Because of where you’re reading this post, I’m going to assume you already know that Grafana is a great tool for visualizing and presenting metrics, and persisting them on dashboards. Ever since the Grafana Loki query builder for LogQL was introduced in 2022, it’s been easy to display and visualize logs, too.

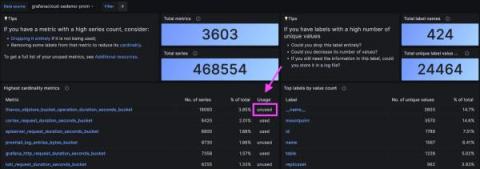
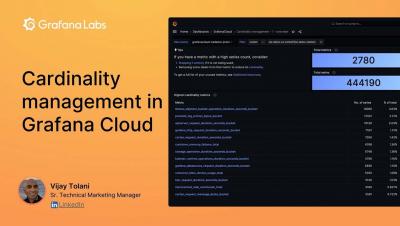
Identify unused, costly metrics with Cardinality Management dashboards in Grafana Cloud

Organizations are dealing with an explosion of metric data as they shift to cloud native architectures and adopt tools like Prometheus and Kubernetes. This in turn can lead to surges in spending on observability metrics. So while teams want a way to scale out metrics adoption to improve their observability — and thus, improve system performance and reliability — they also need to be mindful of skyrocketing costs that could scuttle those efforts before showing meaningful results.

The Leading Open Source Dashboard Software

There are many advantages to using dashboards that are powered by open-source technology that make them a compelling choice for many organizations. Below we will discuss some of the major benefits of using dashboards that are built with the help of open-source technology, along with examples of some of the leading use cases for which open-source technology has been utilized.

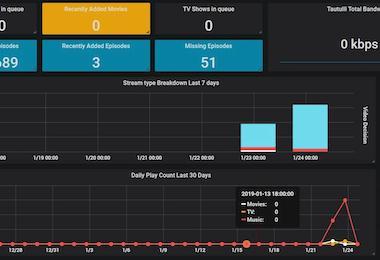
The leading InfluxDB Dashboard Examples

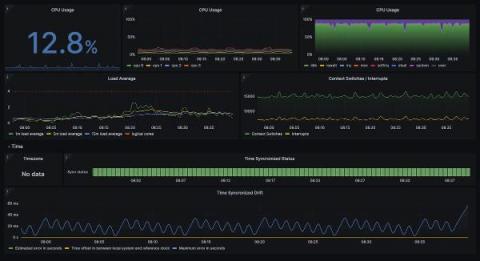
InfluxDB is a powerful tool for managing time-series data. It is widely used in industries such as IoT, finance, healthcare, and more. Using InfluxDB, you can query and store large amounts of data in real-time, making it easier to identify patterns, trends, and anomalies. InfluxDB dashboards provide a comprehensive overview of your system performance, metrics, and KPIs in real-time. You can customize these dashboards to meet your specific requirements.

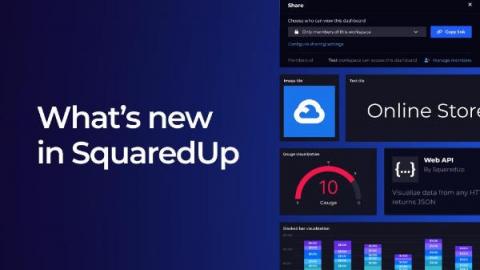
Launching a new dashboarding experience

Since we launched the new SquaredUp last Fall, our focus has been making it easier than it’s ever been to connect to any data source, build beautiful dashboards, and share them with anyone. Today we’re excited to announce a fully redesigned dashboarding experience that does just that. The new dashboarding experience remains backed by data mesh technology, which means your data stays where it lives – it’s simply stitched together and available on-tap from the source.