Operations | Monitoring | ITSM | DevOps | Cloud

Dashboards

User-centered observability: load testing, real user monitoring & synthetics | ObservabilityCON 2023

Understanding your end users’ experience with your applications and services is critical, and there are a variety of tools to help. But there are also a number of different use cases: During development or in production? Simulate user behavior or monitor real user behavior? What should you use and when? This recorded session explores when and how to apply load testing, synthetic monitoring, and real user monitoring to gain insights into the end user experience of your critical applications.

Grafana SLO Demo: Prioritize critical resources with SLO-driven IRM | ObservabilityCON 2023

A majority of respondents in our Observability Survey said they were using SLOs or moving in that direction. For good reason: By highlighting the most critical error budget burndown, service level objectives (SLOs) can help you prioritize performance issues based on business impact. In this recording, Josh Abreu Mesa and Reem Tariq walk through how Grafana Cloud’s integrated SLO and Incident Response Management (IRM) capabilities can help you identify the most important issues and resolve them quickly.

How Pipedrive switched its observability stack to OpenTelemetry & LGTM | ObservabilityCON 2023

The cloud-based CRM company Pipedrive has been relentlessly modernising its observability stack, first adopting Grafana visualisation and Grafana Mimir for Prometheus metrics, then recently completed a migration of its distributed tracing from a third-party SaaS provider to OpenTelemetry and Grafana Tempo, and its logging stack from Graylog to Grafana Loki. Along the way, the team developed its own in-house library to include OpenTelemetry in its roughly 750 microservices.

Manage metrics & logging costs with Grafana Cloud + Log Volume Explorer demo | ObservabilityCON

Are your SRE and platform teams under pressure to ingest fewer metrics and logs in the name of cost savings? Reducing costs does not have to mean reduced observability. This recording walks through the cost management features in Grafana Cloud that allow you to analyze, attribute, monitor, and optimize your metrics and logs usage – and lower costs – without compromising your observability strategy.

How the LGTM Stack changed the observability culture at Wise Payments

The observability team at Wise Payments – Europe’s leader in cross-border money transfers – had long provided the company’s developers access to a multitude of tools. But as costs and complexity increased, Ibukun Itimi, Engineering Lead for Observability and Andrew Brown, Reliability Squad Lead, saw an opportunity to change not only the tools they were using, but also the observability culture.

Best practices to scale and modernize your observability strategy

ObservabilityCON 2023 took place in London this week, showcasing all the latest and greatest trends in open source observability. Following the opening keynote, the event featured a range of breakout sessions — led by both Grafana Labs experts and members of the Grafana OSS community — that explored observability best practices and lessons learned.

The Grafana OpenTelemetry Distribution for Java: Optimized for Application Observability

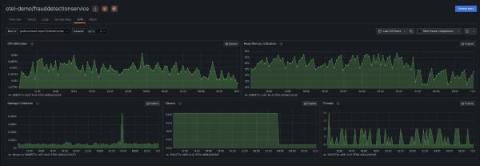
The OpenTelemetry project provides many different components and instrumentations that support different languages and telemetry signals. However, new users often find it hard to pick the right ones and configure them properly for their specific use cases. For this reason, OpenTelemetry defines the concept of a distribution, which is a tailored and customized version of OpenTelemetry components. Here at Grafana Labs, we are all-in on OpenTelemetry.

The Grafana OpenTelemetry Distribution for .NET: Optimized for Application Observability

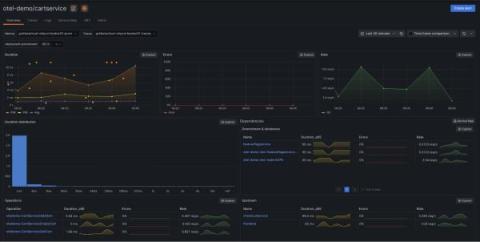
The OpenTelemetry project provides many different components and instrumentations that support different languages and telemetry signals. However, new users often find it hard to pick the right ones and configure them properly for their specific use cases. For this reason, OpenTelemetry defines the concept of a distribution, which is a tailored and customized version of OpenTelemetry components. Here at Grafana Labs, we are all-in on OpenTelemetry.

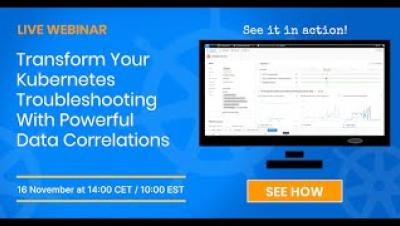
Transform Your Kubernetes Troubleshooting With Powerful Data Correlations

As developers and engineers, we're all too familiar with the manual labor of connecting disparate data points—metrics, logs, events and resource status. We're also familiar with a continual need to simplify and unify these elements into a seamless troubleshooting experience. This on-demand webinar looks at how data correlation approach provides a holistic view of complex system interactions and can move you from issue awareness to full resolution without juggling different tools or performing mental gymnastics. All on a single dashboard!

Dashboarding Azure Monitor SCOM MI in SquaredUp

Big news! Microsoft have just dropped Azure Monitor SCOM Managed Instance (SCOM MI), their cloud-based alternative to SCOM. It’s fully Microsoft managed, and so it promises to take the headache out of deploying, scaling, and managing your SCOM Management Groups. Read Microsoft’s announcement blog to learn all about it.