Operations | Monitoring | ITSM | DevOps | Cloud
Dashboards
Set and scale service level objectives in Grafana Cloud: Introducing Grafana SLO
When we began offering Grafana Cloud Metrics, we set a service level agreement (SLA) for 99.5% of requests to be completed within a few seconds. So we built an alert that would go off if more than 0.5% of requests were slower than a couple of seconds within a five-minute moving window. Sounds reasonable, right?
ObservabilityCON 2023 - Opening Keynote (Live)
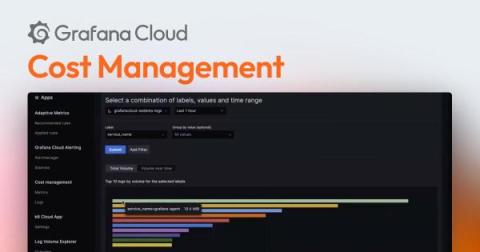
Managing observability spend with Grafana Cloud's Cost Management Hub
Grafana Cloud + Asserts for more efficient root cause analysis | Demo
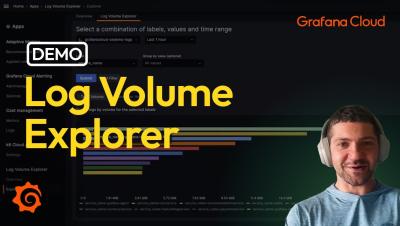
How to map log volume to teams with Grafana Cloud's Log Volume Explorer | Demo
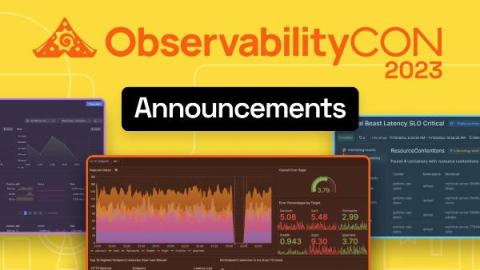
ObservabilityCON 2023: Major news announcements, product releases, and more!
During the opening keynote of ObservabilityCON 2023 in London, we announced a range of new updates to make it easier and faster for the open source observability community to get started and scale their observability stacks.
Manage log volumes, metrics cardinality, monthly bills: Explore Grafana Cloud cost management tools
As more organizations adopt observability at massive scale, they have also been grappling with rising costs. Over the past 12 months, we have been working on different solutions to help our users better understand and manage their observability stack, not to mention the bills that come with scaling it.
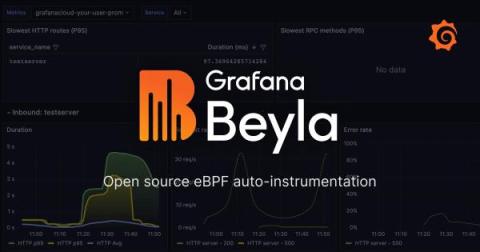
Grafana Beyla 1.0 release: zero-code instrumentation for application telemetry using eBPF
Just two months after introducing the public preview of Grafana Beyla, we are excited to announce the general availability of the open source project with the release of Grafana Beyla 1.0 at ObservabilityCON 2023 today. We’ve worked hard in the last two months to stabilize, stress test, and refine the features that were part of the public preview of this open source eBPF auto-instrumentation tool.
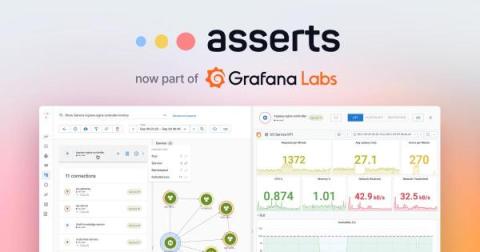
How Asserts.ai will make it even easier for Grafana Cloud users to understand their observability data
At Grafana Labs, our mission has always been to help our users and customers understand the behavior of their applications and services. Over the past two years, the biggest needs we’ve heard from our customers have been to make it easier to understand their observability data, to extend observability into the application layer, and to get deeper, contextualized analytics.


