Operations | Monitoring | ITSM | DevOps | Cloud

Dashboards

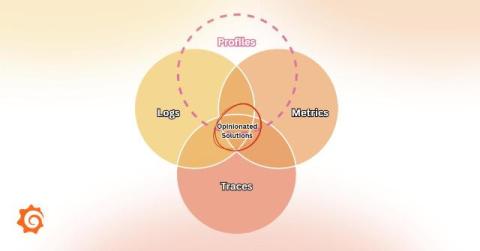
What is Observability? Grafana for Beginners Ep. 1

When you are getting started with observability, the jargon and concepts used to explain observability may go straight over your head. Let’s take out the complexity and talk about observability in the simplest terms possible. Join Lisa Jung, a senior developer advocate at Grafana, to get your learning on with the Grafana for Beginners series. You will learn about concepts such as observability and DevOps and how Grafana can be used to observe your system as a part of your DevOps practice.

Grafana Tempo 2.3 release: faster trace queries, TraceQL upgrades

Grafana Tempo 2.3 has been unleashed upon the world, bringing with it the latest iteration of the vParquet backend! Tempo 2.3 has a little bit of everything, but the headline item here is vParquet3 and new features that improve search speeds. Watch the video above for all the details, or continue reading to get a quick overview of the latest updates in Tempo. If you’re looking for something more in-depth, don’t hesitate to jump into the changelog or our Grafana Tempo 2.3 release notes.

How to configure OpenTelemetry .NET Automatic Instrumentation with Grafana Cloud

For those who have limited experience with OpenTelemetry, it can be intimidating to instrument.NET applications. But the OpenTelemetry community created a welcome shortcut with the first stable release of.NET Automatic Instrumentation. It simplifies the process of collecting metrics, logs, and traces from your.NET applications, without applying any changes to the source code or adding any dependencies to the OSS project.

Create a logs app plugin with Grafana Scenes and Grafana Loki

Grafana’s plugin tools help developers extend Grafana’s core functionality and create plugins faster, with a modern build setup and zero configuration. Grafana Scenes, meanwhile, is a new front-end library, introduced with Grafana 10, that enables developers to create dashboard-like experiences — such as querying and transformations, dynamic panel rendering, and time ranges — directly within Grafana application plugins.

How to integrate a Spring Boot app with Grafana using OpenTelemetry standards

Maciej Nawrocki, Senior Backend Developer at Bright Inventions, is a backend developer focused on DevOps and monitoring. Adam Waniak, Senior Backend Developer at Bright Inventions, is a backend developer with a keen interest in DevOps. Bright Inventions is a software consulting studio based in Gdansk, Poland, with expertise in mobile, web, blockchain, and IOT systems. At Bright Inventions, we always prioritize app optimization when we develop software solutions for our clients.

Real user monitoring with Grafana (Grafana Office Hours #17)

Have you heard of Grafana Faro and how it can help in providing insights into your real user experience? Developer Advocates Nicole van der Hoeven and Marie Cruz chat with Software Engineers Kostas Pelelis and Marco Schaefer to discuss what Grafana Faro is, why it's important to have a real user monitoring solution, and how to get started with Grafana Faro.

Grafana panel title generator, interactive visualizations, and more

Dive deep into the enhancements in Grafana 10.2. From embedding interactive buttons within Canvas visualizations to utilizing AI for dashboard titles and descriptions, this release brims with features designed to optimize your Grafana experience. In this video, discover how to: Stay with us through this playlist to delve deeper into each addition and maximize your Grafana 10.2 experience.