Operations | Monitoring | ITSM | DevOps | Cloud

Dashboards

Announcing... Markdown magic

We're excited to share a small but mighty new feature. Our Text tile now supports Markdown! This allows you to include rich content on your dashboards such as headings, links, lists, images and more. At SquaredUp we know that a useful dashboard is more than just a few charts. With this update you can now provide key context to the data on a dashboard to help tell the right story. For example you might want to: You can easily do all that now, and more.

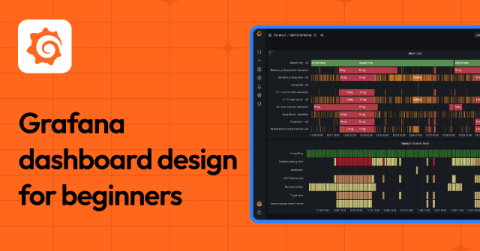
Getting started with Grafana: best practices to design your first dashboard

At its core, observability is about helping humans understand and optimize complex systems. It enables engineering teams to ask questions on the fly, and to learn not only when something goes wrong but why. Observability also allows organizations to proactively identify and address performance issues — before their end users even have a chance to notice.

Identify anomalies, outlier detection, forecasting: How Grafana Cloud uses AI/ML to make observability easier

At Grafana Labs, our No. 1 approach when building AI/ML tools is to enable humans (a.k.a. all of us!) to understand complex systems. In other words, we want to make observability still human, but less complicated. (Our second use case? Making social media more fun.) We believe that AI/ML tools in observability should work towards minimizing toil and the need for everyone in your organization to have the same deep domain knowledge about your increasingly complex stack.

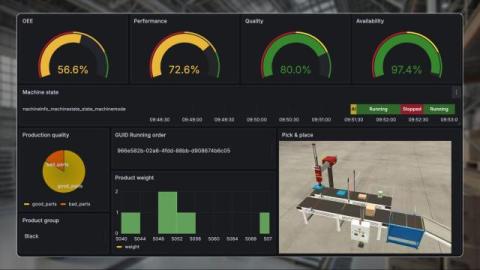
Industrial IoT visualization: Why United Manufacturing Hub chose Grafana to power its IIoT platform

Denis Gontcharov is a data consultant who helps aluminum smelters break down data barriers. For the past five years, he has supported the aluminum industry with IT and data services as an independent consultant. Denis also works as a Developer Advocate at the United Manufacturing Hub. Jeremy Theocharis is co-founder and CTO at United Manufacturing Hub. He is an expert in industrial IoT with over seven years of experience leading large-scale IIoT projects in various industries.

The Top IT Dashboard Examples

A vital aspect of working in IT is that you need to effectively monitor a broad range of KPIs and metrics to ensure the smooth operation of your IT infrastructure. IT dashboards streamline this process as they are specialized dashboards designed to offer insights and track key performance indicators (KPIs) related to numerous aspects of IT operations and infrastructure.

Azure DevOps success with out-of-box dashboards & monitoring

In previous roles I have been both an Engineering Manager responsible for a team, and a Program Manager responsible for branching strategy and process around CICD pipelines. In both of those roles (but for very different reasons), my product's build quality has been critical to product success. The obvious "why" to this is no builds, no product, but the real why is much more nuanced.

Azure Virtual Machine out-of-box dashboard makes it easier to get started

I first started my career in IT support back in 2003 when VMs where something that was “coming” rather than mainstream, so I had the privilege of witnessing the birth of VMs first hand when my company made the switch from bare metal to VMware GSX running on top of Windows Server 2003.

Grafana 11.1 release: new visualization features, Grafana Alerting updates, and more

The Grafana 11.1 minor release comes on the heels of unveiling Grafana 11 at GrafanaCON, but it packs in some ease of use visualization improvements, updates to Grafana Alerting (I spy a new settings page), and some impactful changes to the overall accessibility of Grafana.