Operations | Monitoring | ITSM | DevOps | Cloud

Dashboards

Grafana Cloud updates: new data visualization options, enhancements to Grafana Cloud k6, and more

We consistently roll out helpful updates and fun features in Grafana Cloud, our fully managed observability platform powered by the open source Grafana LGTM Stack (Loki for logs, Grafana for visualization, Tempo for traces, and Mimir for metrics). In case you missed it, here’s a roundup of the latest and greatest updates for Grafana Cloud this month. You can also read about all the features we add to Grafana Cloud in our What’s New in Grafana Cloud documentation.

AVD Performance Dashboard

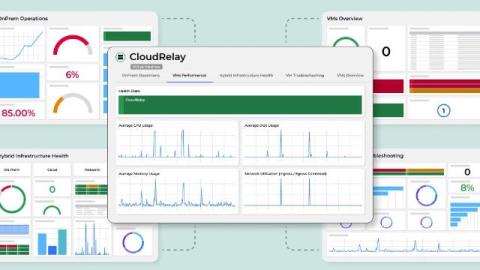
In this dashboard tutorial video, we will walk you through building an Azure Virtual Desktop dashboard. This dashboard provides users with the visibility they need into the status of Azure Virtual Desktop. The Azure Virtual Desktop dashboard combines CloudReady and Service Watch metrics for a holistic view of Azure Virtual Desktops availability and performance. When issues occur, users can quickly review the dashboard to identify whether the issues is limited to an office, individual device, or affecting Azure Virtual Desktop as a whole.

How to Query Span Events with TraceQL | Tempo Tutorial | Grafana Labs

Span events provide many benefits and can help you improve your distributed tracing game. In this video, the Grafana Tempo team goes over when to add span events to your traces. We will show you how to use TraceQL to query for span events to get useful information about your services to help you track down bugs and chase down bottlenecks faster. Grafana Cloud is the easiest way to get started with Grafana dashboards, metrics, logs, and traces.

Getting started with GitHub Data source plugin - Visualize your repos | Grafana

Learn step-by-step how to monitor and visualize your GitHub data by using the Grafana GitHub Data source plugin. It provides a lot of features such as query Commits, Pull Requests, Workflows, Vulnerabilities etc. Join Senior Developer Advocate Syed Usman Ahmad in this complete video tutorial and learn to use the GitHub plugin.

All about span events: what they are and how to query them

If you’re already familiar with distributed tracing, you know that spans are the building blocks of traces. But are you sleeping on what span events can do for you? First, you may need a wake-up call as to what a span event even is. While spans represent units of work or operation within a trace, a span event is a unique point in time during the span’s duration.

Visualized Microsoft 365, Oracle, DB2, and VMware Monitoring

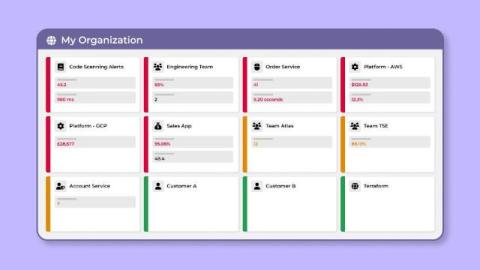
NiCE IT Management Solutions has unveiled a new suite of dashboards designed to enhance the monitoring and visualization of critical enterprise applications, including Microsoft 365, Oracle, DB2, and VMware, within the SquaredUp platform. These dashboards are built on top of NiCE’s SCOM Management Packs, offering a seamless integration that provides IT teams with deeper insights and greater control over their monitoring environments.

Getting Started with Grafana Plugin Development | Grafana Plugin Development

Learn how to get started creating Grafana plugins with this comprehensive guide that covers the tools you will need, the different types of plugins to choose from, the anatomy of a Grafana plugin, how to run your Grafana plugin in development mode, as well as outlines the next steps.