Operations | Monitoring | ITSM | DevOps | Cloud

Dashboards

Kibana vs. Grafana - A Scenario-Based Decision Guide [2024]

Both Kibana and Grafana are data visualization tools providing users capabilities to explore, analyze and visualize data with dashboards. The difference between Kibana and Grafana lies in their genesis. Kibana was built on top of the Elasticsearch stack, famous for log analysis and management. In comparison, Grafana was created mainly for metrics monitoring supporting visualization for time-series databases.

Why companies choose Adaptive Metrics and how they save time and (a lot of) money

Let’s cut to the chase: Managing metric volumes at scale is hard. In fact, when we asked the open source observability community about their biggest concerns in this year’s Grafana Labs Observability Survey, the top four responses — cost, complexity, cardinality, and signal-to-noise ratio — can all be tied back to exponential growth in telemetry data.

Observe deleted Kubernetes components in Grafana Cloud to boost troubleshooting and resource management

As a site reliability engineer, you need constant vigilance and a keen eye for detail if you want to manage your Kubernetes infrastructure effectively. As part of that effort, you need to see the historical data from your pods, nodes, and clusters — even after they’ve been deleted or recreated. Many SREs rely on kubectl for this, and while it’s indispensable for real-time Kubernetes management, it presents some significant challenges with historical data.

Data Visualization Tools For InfluxDB: Grafana, Tableau, and Apache Superset

Integrating data visualization tools with databases like InfluxDB is crucial for developers looking to enhance analytical capabilities and derive actionable insights from complex datasets. Grafana, Tableau, and Apache Superset—all of which you can use with InfluxDB—are popular visualization tools with different features and benefits.

How to integrate Okta logs with Grafana Loki for enhanced SIEM capabilities

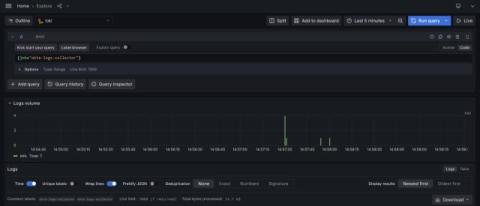
Identity providers (IdPs) such as Okta play a crucial role in enterprise environments by providing seamless authentication and authorization experiences for users accessing organizational resources. These interactions generate a massive volume of event logs, containing valuable information like user details, geographical locations, IP addresses, and more. These logs are essential for security teams, especially in operations, because they’re used to detect and respond to incidents effectively.

Prometheus data source update: Redefining our big tent philosophy

As we continue adding to our growing catalog of more than 100 plugins for Grafana, we have been focused on developing data sources for Grafana that are more purpose-built for the respective technologies. One example has been the recent update to our core Prometheus data source. We have deprecated AWS authentication from the original Prometheus data source, and we created a new dedicated Amazon Managed Service for Prometheus plugin that will specifically cater to the AWS use case.

How to Send Prometheus Metrics to Grafana Cloud Using Alloy | Ask the Experts | Grafana

"How do I push metrics using Grafana Alloy?" William Dumont from the Grafana Alloy team answers the question by showing you how to collect Prometheus metrics and forward them to Grafana Cloud using Grafana Alloy. This video is just a preview of what you can expect from our Ask the Experts booth at ObservabilityCON and GrafanaCON. The Grafanistas behind our solutions, features, and the LGTM Stack can provide answers to your toughest questions on the spot.

How to Send Grafana Alloy Logs to Grafana Loki | Ask the Experts | Grafana

In this video, Matt Durham, Sr. Software Engineer on the Grafana Alloy team, shows you how to send Grafana Alloy logs to Loki. Specifically, we address the question: "Is it possible to send data from one Grafana Alloy to another? Could anyone supply me with config examples of such interactions? If I send data from Grafana Alloy directly to Loki, it is working. If I send data from Grafana Alloy to another, and then to Loki, the second instance gives me an error.".

Network Performance Dashboard

In this dashboard tutorial video, we will walk you through building a Network Performance dashboard. This dashboard provides users with the visibility they need into the status of their network performance from their offices down to an individual users device. Obtaining this single pane of glass visibility is made easy with the combination of both CloudReady and Service Watch metrics into dashboards. When utilizing these dashboards, users can quickly identify which networks are performing poorly, allowing them to quickly resolve issues and ensure end users have an optimal experience.

Grafana Alloy 1.3 release: Debug pipelines in real time

Grafana Alloy 1.3 is here! First introduced earlier this year, Alloy is our open source distribution of the OpenTelemetry Collector. It has native pipelines for OpenTelemetry and Prometheus telemetry formats, and it uses the same components, code, and concepts that were previously introduced in Grafana Agent Flow. This new release introduces live debugging, enhancing debugging capabilities across key components, which are the building blocks of Alloy.