Operations | Monitoring | ITSM | DevOps | Cloud
Introducing Metric Alert notification charts and Duplicate Alerts
Unless you stare at Sentry all day waiting for error or performance problems to pop up, chances are you rely on alerts to let you know when something breaks or slows down. There are two types of alerts you can set up: 1) Issue Alerts, which are tied to issues that meet predefined criteria, and 2) Metric Alerts, which trigger when error volume or performance metrics like apdex, latency, or throughput surpass a pre-defined threshold.
CFEngine 3.15.6 and 3.18.2 released
We are pleased to announce two new patch releases for CFEngine, version 3.15.6 and 3.18.2! These releases mainly contain bug fixes and dependency updates.
Collect More Data with Windows Server Support in Cribl Edge 3.5
Cribl Edge is the easiest and most manageable agent for exploring, processing, and collecting Observability data at the edge for Linux servers. Today, we’re excited to announce that it’s not just Linux admins whose lives have been made easier with Edge. With the Cribl Software Suite 3.5.0, Cribl Edge now supports Windows Server 2016, 2019, and 2022, bringing that same intuitive experience for deploying, setting up, and collecting observability events to your Windows infrastructure.
Bring More Reliability and Insights to Your Observability Pipelines with Cribl Stream 3.5
We’ve been busy building more features for Cribl Stream, and are excited to share the new value we offer our users. Cribl Stream 3.5 is now available! This release brings some much-requested features that will help users build more robust observability pipelines, with new sources and destinations. Let’s dive into what’s new!
Cribl.Cloud Summer 2022 Release Helps You Be Even More Proud of Your Cloud
Cribl.Cloud’s Summer 2022 release is now available in an AWS cloud near you! As part of this release, we are excited to share the features we have been building, including the latest Cribl product releases (Stream 3.5 and Edge 3.5). This release brings some much-requested features that will help customers increase their compliance, reduce overall costs, and deploy a more resilient observability data pipeline.
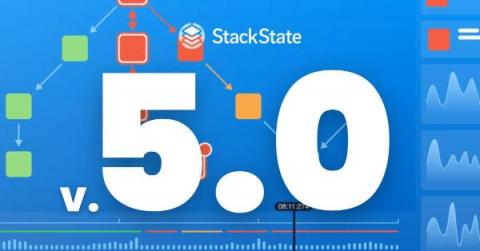
StackState's v5.0 Release Delivers New 4T Monitors and More: Apply the Power of Topology to Transform Traditional IT Monitoring
This week we released v5.0 of StackState’s observability and AIOps platform, which introduces a rich set of new capabilities. Our latest release contains a little something for everyone responsible for reliably running business critical workloads in dynamic environments – SREs, DevOps, central platform teams, even business teams – and for new and existing users alike.
What's New Pandora FMS 763 RRR
Let’s check out together the new features and improvements included in the newest Pandora FMS release: Pandora FMS 763.
Elastic Observability 8.3: Broader observability for cloud, SaaS, and big data
Note 8.3.0 has an issue that could cause creating and accessing snapshots against Azure snapshot repositories to fail authenticating when using SAS tokens. This impacts self-managed customers who have deployed 8.3.0. Elastic Cloud Azure deployments are not currently being upgraded to 8.3.0 and are not impacted as a result. Visibility is crucial for ensuring application performance but it can be difficult to efficiently scale monitoring across all your critical infrastructures, platforms, and services.
Elastic Enterprise Search 8.3: More ingestion options for searching across any dataset
8.3.0 has an issue that could cause creating and accessing snapshots against Azure snapshot repositories to fail authenticating when using SAS tokens. This impacts self-managed customers who have deployed 8.3.0. Elastic Cloud Azure deployments are not currently being upgraded to 8.3.0 and are not impacted as a result. The latest release of Elastic Enterprise Search brings to market enhancements to getting data into Elastic Enterprise Search.


