Operations | Monitoring | ITSM | DevOps | Cloud
Integration
The 18 most popular data source plugins for Grafana in 2021
As a composable solution, Grafana allows you to bring your data into dashboards natively without having to extract it, load it, or transform it. We believe in a “big tent” philosophy, which allows you to choose the tools that best suit your observability strategy, and with our plugins, Grafana is interoperable with more than 100 data sources.
New Apps for PagerDuty's Datadog Integration
New Integrations from Logz.io: November 2021
It’s been a busy couple of months at Logz.io. We’ve added new features, made critical updates, and added a slew of integrations. Those integrations run the gamut from observability and security services, to cloud tools and container orchestration. Let’s take a quick look at what’s new and what’s coming up at Logz.io.
Building Automated Monitoring with Icinga and SIGNL4
How many servers can be managed by one system administrator? This question is not an easy one since it definitely depends on the tasks that need to be operated. However, it´s quite clear that the amount of servers one engineer can manage has increased enormously over time, and is still growing. Yet, public and private clouds, combined with automation tools, enable us to automate many daily tasks. In a modern IT infrastructure almost everything can, and should, be automated.
Future Trends & Technology for Your Integration Infrastructure
Integration is now the #1 IT expense category at many enterprises and new complexities increase the burden on Service Delivery, CI/CD, IBM MQ administration, and other “integration professionals” every day. Your enterprise has Microservices, Mobile, Mainframes, Cloud, and more applications and application updates than you can count and it takes the routing of transactions, messages and more through a rapidly growing integration infrastructure layer to make it all work together.
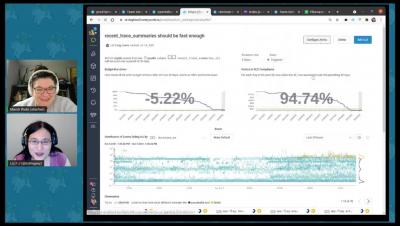
PagerDuty Integration Spotlight: Honeycomb
Reliable Alerting with Icinga and SIGNL4
You’ve probably been in this situation before – you’re using Icinga to monitor your infrastructure and Icinga detects a critical issue but nobody notices it. It might be an urgent maintenance request, an unexpected breakdown, or a service quality issue. But your technicians or service engineers are neither in the control room nor in front of the dashboard to see the issue and its urgency.


