Operations | Monitoring | ITSM | DevOps | Cloud

Sentry and Rookout Integration: A Better way to Find and Debug Errors in Your Code

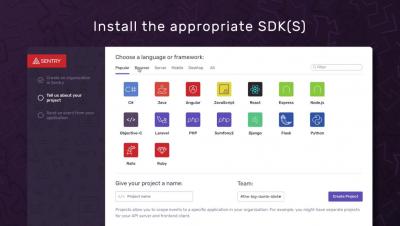
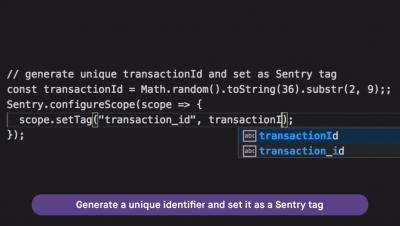
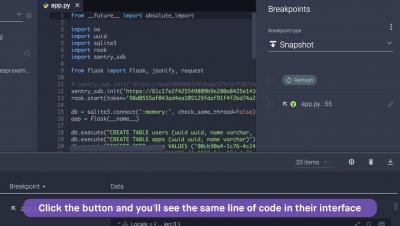
Rookout’s new Sentry integration empowers you to fix bugs faster than ever before. Sentry features allow you to identify the exact location of an error in your code. With the Rookout integration, you will find an additional prompt to debug the issue live, in production, in Rookout. With the click of a button you will see the same line of code from Sentry highlighted in Rookout’s IDE-like interface, without restarting, redeploying or adding more code. In Rookout you can set non breaking breakpoints and trigger the error again to receive the real time debug data.

Application Monitoring Overview: How to Track Errors with Sentry

A quick walkthrough of the Sentry application monitoring platform. In just a few steps, Sentry allows developers to identify and fix production errors across every application in the stack. Get started by installing the appropriate SDK for your platform or platforms. All unhandled exceptions will be automatically captured by Sentry, with individual errors rolling up into larger issues. You will be able to quickly learn the impact of specific problems, examine the stack trace, and get added context about the application state, so you can connect issues to the root cause.

Distributed Tracing with Sentry: How to Find the Root Cause of Errors Across Applications

Implementing Sentry on all your services allows you to use distributed tracing to find the root cause of errors. Just because an error happens in a browser or mobile app, doesn’t mean the issue is with the frontend or mobile code. The issue could stem from an error with code in a different project that they interact with in some way. Distributed tracing empowers developers to find the actual cause of hard to fix issues.

IBM's journey to tens of thousands of production Kubernetes clusters

IBM Cloud has made a massive shift to Kubernetes. From an initial plan for a hosted Kubernetes public cloud offering it has snowballed to tens of thousands of production Kubernetes clusters running across more than 60 data centers around the globe, hosting 90% of the PaaS and SaaS services offered by IBM Cloud. I spoke with Dan Berg, IBM Distinguished Engineer, to find out more about their journey, what triggered such a significant shift, and what they learned along the way.

Announcing General Availability of PagerDuty's Slack Integration

When PagerDuty’s VP of Product Management Rachel Obstler announced the beta version of our new Slack integration in April in her “Anticipating, Monitoring, and Managing Incidents via Slack” panel at Slack Frontiers, we expected significant interest in the integration among our customers.

Open Source can be a silver bullet, but your application might be a werewolf

I was reminiscing about an incident that happened at a past job with an old co-worker. You know the one, the one where you installed a library that makes some task of yours simple, only to reveal the library makes things worse. This incident in particular involved the way that images served out of our Ruby on Rails application, and the library that made it possible to “easily resize before serving” them.

How to collect, customize, and centralize Node.js logs

When you need to troubleshoot an issue in your Node.js application, logs provide information about the severity of the problem, as well as insights into its root cause. You can use logs to capture stack traces and other types of activity, and trace them back to specific session IDs, user IDs, request endpoints—anything that will help you efficiently monitor your application.