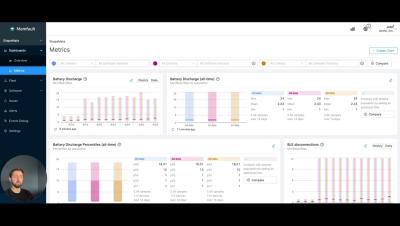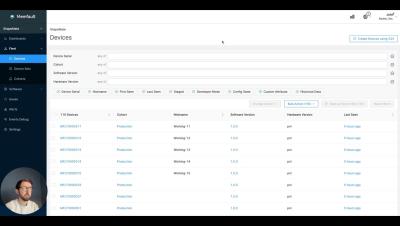
Device List CSV Export || Memfault Feature Highlights
In this feature highlight we take a quick look at building custom device lists for exporting via CSV.


A few days ago a memo from logistics company Flexport leaked to the media announcing significant layoffs. Now, a tech company doing layoffs in 2023 is hardly notable. A 20% RIF here and there is almost expected. What is notable is the reason for the layoffs: Flexport is trying to achieve profitability.
Live debugging refers to debugging software while running in production without causing any downtime. It has gained popularity in modern software development practices, which drives many critical systems across businesses and industries. In the context of always-on, cloud-native applications, unearthing severe bugs and fixing them in real time is only possible through live debugging. Therefore, live debugging becomes an integral part of any developer’s skill set.
Platform engineering has been one of the hottest keywords in the software community in recent years. As a natural extension of DevOps and the shift-left mentality it fosters, platform engineering is a subfield within software engineering that focuses on building and maintaining tools, workflows, and frameworks that allow developers to build and test their applications efficiently.
Alerts and notifications have been part of TrackJS since the very beginning. Our standard notification options reflect our desire to keep things simple. Over time though, our customers have asked to customize their alerts and fine tune them to specific scenarios. To support that use case, we’re releasing a new kind of notification we’re calling “Saved Filter Notifications”.
PC applications that interact with MCUs are used by developers for a number of reasons, such as data visualization, monitoring during testing campaigns, and command and control via a GUI. In this article, we’ll explore mapping an MCU’s peripherals to your personal computer to simplify development of PC applications built for embedded systems. Like Interrupt? Subscribe to get our latest posts straight to your mailbox.
Today’s applications are designed to be always available and serve users 24/7. Performing live debugging on such applications is akin to doctors operating on a patient. Since the advent of the “as a service” model, software is like a living, breathing entity, akin to an anatomical system. Operating on such entities requires more dexterity on the developer’s part, to ensure that the software application lives on while being debugged and improved continuously.