Operations | Monitoring | ITSM | DevOps | Cloud

APM

The latest News and Information on Application Performance Monitoring and related technologies.

Diving in to OpenTelemetry data with our new Trace and Logs Explorer

The team at SigNoz would like to share recent developments released this month that greatly enhance the ability to dynamically query your trace and log data. With these tools anyone can explore complex OpenTelemetry data and gain insight into their stack.

Measuring the time between spans in an OpenTelemetry trace with a Clickhouse query

In a recent conversation on our SigNoz community Slack, a user shared their query that asks a deceptively simple question: what is the average time between two spans in a trace? The usefulness of this answer is evident if you think about how often the total trace time does not highlight the time you care about most. This could mean any number of things: that the total trace time of handling a web request might include lots of spans after a satisfying response was sent to the user.

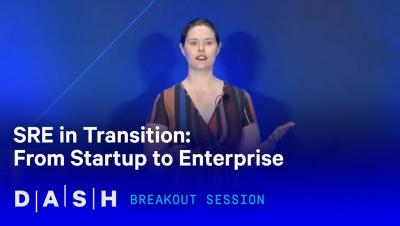
SRE in Transition: From Startup to Enterprise

"Startups are defined by “ship or die”. As a result, SRE teams at a startup should be focused on enabling product engineers to ship features as quickly as possible. As your startup transitions from “we’ll run out of money in the next 18 months” to “we have more than 1000 engineers”, how should the SRE organization evolve and provide the best value through that transition (including booting one up if you don’t have one)? I will discuss specific ways the organization needs to evolve to meet this challenge, how the SRE org can advocate for and support this change (both in direct actions and in “influence”), and how the overhang of startup technical and cultural debt can make this shift more challenging (but also more necessary).

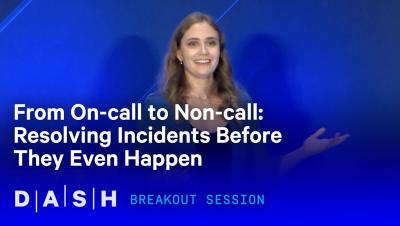
From On-call to Non-call: Resolving Incidents Before They Even Happen

Artificial intelligence has captured the attention of the world, with tools like ChatGPT and large language models (LLMs) driving the conversation. But you don’t need to wait for the future or new features powered by LLMs to start working smarter—the tech industry has been investing in intelligent, automated tools for years and they’re ready for production now. In this talk, you’ll learn how the engineering teams at Toyota Connected use tools like Datadog Watchdog, Anomaly Detection, and Workflows to make our lives easier and keep our platform stable.

From Solution to Startup

Before Datadog was a widely adopted SaaS platform, it was a tool developed to solve our founders’ own monitoring needs. As technology-oriented people, we often build solutions for our own problems, then discover those problems are widespread. But how do you know when your solution should be something more? In this panel session, we’ll talk with tech startup founders to hear their stories and advice for turning tools into businesses.

Deliver exceptional digital experiences with Cisco Cloud Native Application Observability

From the application layer down to your Kubernetes® infrastructure, Cisco Cloud Native Application Observability delivers cross-domain visibility with correlated MELT data and AI/ML-driven insights to simplify the complexity of observing the performance of modern applications, multi-cloud Kubernetes, and hybrid cloud infrastructure.

A guide to single-page application performance

Many of us have heard single-page applications (SPAs) hailed as the future of web applications. Proponents of SPAs point to increased code reusability and development velocity, and the advantage SPAs can give when it comes to delivering a fast and seamless user experience. Massive sites like Facebook, AirBnB and Trello are all built as SPAs. On the flipside, monitoring SPAs for performance is pretty challenging.

Elastic APM - Automatic .NET Instrumentation with OpenTelemetry

Check out this YouTube video on Elastic Application Performance Monitoring (APM) and its integration with OpenTelemetry for.NET! In this informative and practical tutorial, we delve into the world of APM and demonstrate how to effectively instrument your.NET applications using OpenTelemetry with Elastic APM. Additional Resources: Connect with us on social media.

What is Garbage Collection in Java: Detailed Guide

The Garbage Collection (GC) feature in the Java Virtual Machine (JVM) is truly remarkable. It automatically identifies and cleans up unused Java objects without burdening developers with manual allocation and deallocation of memory. As an SRE or Java Administrator you need a strong understanding of the Java Garbage Collection mechanism to ensure optimal performance and stability of your Java applications.