Announcing the Enhanced Usage Dashboard
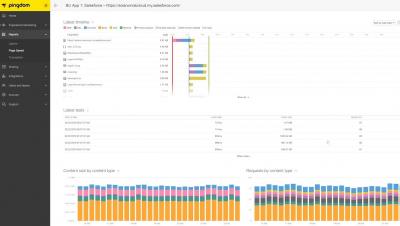
Many of our users are responsible for monitoring logs to detect sudden changes in volume or to control the budget. To help you with this goal, we’re excited to announce new enhancements to our usage dashboard.


Many of our users are responsible for monitoring logs to detect sudden changes in volume or to control the budget. To help you with this goal, we’re excited to announce new enhancements to our usage dashboard.
It doesn’t matter what industry you’re in — there’s more data at your fingertips than ever before. And with that data comes an opportunity to make informed decisions that will take your business to new heights. For marketing alone, becoming best-in-class at data analytics can help you generate 20 percent more revenue than your competitors. Those benefits increase exponentially when you bring data-driven decision-making to every aspect of your business.
Raygun’s Launch Notes are your regular round-up of all the improvements we made to Raygun last month—from major features to performance updates.
Today, we are excited to announce PagerTree now officially supports stakeholder notifications! With stakeholder notifications it’s easy to keep executives, product managers, or other individuals informed of the status of ongoing incidents.
As application architecture moves from monoliths to microservices, observability has become a growing challenge. The services that make up a distributed application, and the many dependencies and communication pathways between them, are difficult to govern and observe. You can get more control and visibility of your application by including a service mesh—a layer of infrastructure that manages traffic among microservices.
In the new cloud-native world, ephemeral services like containers make security a challenging task. As enterprises start adopting containers in production, they suffer from a great deal of variance in the software, configuration, and other static artifacts that exist across their organization’s container image set.
Infrastructure Monitoring refers to the constant tracking, collection and analysis of data about the infrastructure/server. Using this data, you can monitor the performance and the behavior of the hosts at the infrastructure level. You can also identify the issues that are of concern. For instance, you can periodically check and monitor the health of the hosts and if any slow downs occur, it’s easy to alert the users.