Operations | Monitoring | ITSM | DevOps | Cloud
Observability
The latest News and Information on Observabilty for complex systems and related technologies.
The First OpenObservability Conference is a Wrap
Last week, the first OpenObservability conference took place. This event had amazing content contributions from open source project leaders, users, and influencers. We’ve seen massive growth and adoption in the open source observability space from the inspiring work being done across tracing, logging, and especially metrics. The new data stores and capabilities are growing at breakneck speed. There are more choices— yet more complexity—than ever before.
Can Observability Improve IT Ops? BigPanda's Field CTOs have the answer.
A Harrowing Landscape The increasing complexity of modern services is forcing IT Ops teams to employ a growing landscape of disparate tools to monitor the health of their IT Stack. In fact, the number of tools has grown so much in the last few years, that one wonders how IT Ops teams are even able to effectively configure, maintain, ingest, and process all the events that these tools create.
Identifying and monitoring key metrics for your hosts and systems
This post is the first in a three-part series on how to effectively monitor the hosts and systems in your ecosystem, and we're starting with the one you use most: your personal computer. Metrics are a key part of observability, providing insight into the usage of your systems, allowing you to optimize for efficiency and plan for growth. Let's take a look at the different metrics you should be monitoring.
Elastic Observability Engineer Training Preview: Structuring data
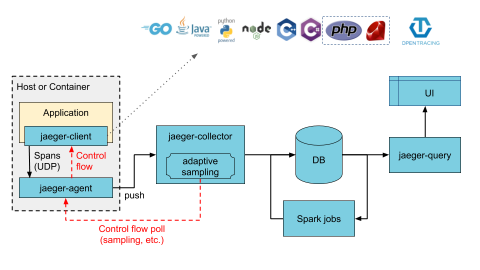
New in Grafana 7.0: Trace viewer and integrations with Jaeger and Zipkin
Moving to a scalable, distributed microservice architecture poses a great deal of challenges for any organization. It gets harder to understand the system and pinpoint where errors originate. Logs get much messier, and stitching together a coherent picture of a particular request can be time-consuming or downright impossible. Distributed tracing can help with all of that.
We listened. Simpler Pricing. You're welcome.
I’ve tackled this question before: how much should my observability stack cost? While the things in that post are true now as ever, I did end on one somewhat vague conclusion. When it came to figuring out exactly what you need in your stack by drawing a straight line from the business case to the money you spend, my conclusion was that “it depends.” That’s how we approached pricing at Honeycomb: it depends on your needs, so we should give you many different options.
Applying AIOps to Logs Is Key for Observability
Logging is an essential method to understanding what’s happening in your environment. Logs help developers and system administrators understand where and when things have gone wrong. Ideally, logs on their own would suffice as indicators of what’s happening. However, there’s far too many log messages being produced in today’s world and most don’t contain the information we actually need.


