Operations | Monitoring | ITSM | DevOps | Cloud

Observability

The latest News and Information on Observabilty for complex systems and related technologies.

Why Splunk customers face a choice for observability and modernization

Elastic Observability is fast, simple, and built for the future Businesses everywhere are facing a challenging environment: increased cost pressures coupled with high volumes of data generated by complex, distributed, cloud-native environments. As a result, teams need smarter analytics, access, and retention across all their data — instantly and from anywhere — to resolve issues, make decisions, and ensure resiliency.

Elastic recognized with 2024 EMA Allstars award for its AI-assisted observability

We are thrilled to be recognized with the 2024 EMA Allstars award. This award acknowledges Elastic’s focus on delivering a full-stack observability solution that provides unified visibility and AI-powered insights into complex hybrid cloud deployments. The EMA Allstars award celebrates trailblazers and innovators who are reshaping the enterprise technology landscape.

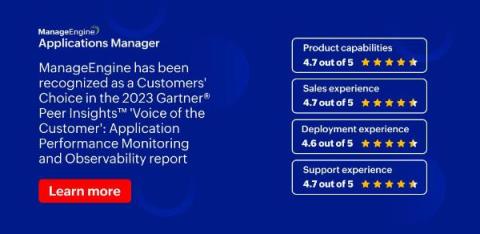
We've done it again: ManageEngine named a 2023 Gartner Peer Insights Customers' Choice for Application Performance Monitoring and Observability!

At ManageEngine, customers are at the heart of everything we do. That’s why we are excited to be recognized as a 2023 Gartner Peer Insights™ Customers’ Choice for Application Performance Monitoring and Observability. This year marks the fifth time we have been recognized with this distinction.

Alerts Are Fundamentally Messy

Good alerting hygiene consists of a few components: chasing down alert conditions, reflecting on incidents, and thinking of what makes a signal good or bad. The hope is that we can get our alerts to the stage where they will page us when they should, and they won’t when they shouldn’t. However, the reality of alerting in a socio-technical system must cater not only to the mess around the signal, but also to the longer term interpretation of alerts by people and automation acting on them.

Effective Trace Instrumentation with Semantic Conventions

There’s plenty of literature on the mechanics of instrumenting code with OpenTelemetry and delivering it to Honeycomb. However, I’ve not found many guides on the craft of instrumenting code in order to have a good observability experience in your system. A lot of focus is placed on automatic instrumentation—which is great, particularly if you’re new to observability or retrofitting—but it misses the power of good instrumentation at the application level.

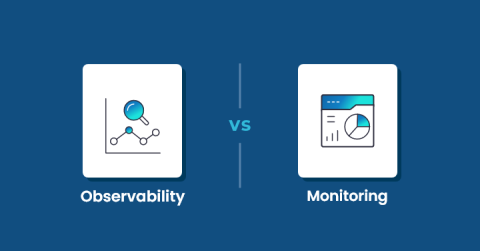
Observability vs. Monitoring: Decoding Key Distinctions

In the evolving digital landscape, transformation has become a necessity for businesses in order to stand out and remain competitive. As per stats records, around 91% of businesses use digital technologies and platforms to run their business more successfully. With excessive dependency on digital technologies, there also comes the challenge of navigating through the complex web of dependencies and interactions.

Elastic Observability 8.12: GA for AI Assistant, SLO, and Mobile APM support

Elastic® Observability 8.12 announces general availability (GA) for the AI Assistant, Service Level Objectives (SLO), and Mobile APM support: Elastic Observability 8.12 is available now on Elastic Cloud — the only hosted Elasticsearch® offering to include all of the new features in this latest release. You can also download the Elastic Stack and our cloud orchestration products, Elastic Cloud Enterprise and Elastic Cloud for Kubernetes, for a self-managed experience.

Monitoring-as-Code for Scaling Observability

As data volumes continue to grow and observability plays an ever-greater role in ensuring optimal website and application performance, responsibility for end-user experience is shifting left. This can create a messy situation with hundreds of R&D members from back-end engineers, front-end teams as well as DevOps and SREs, all shipping data and creating their own dashboards and alerts.