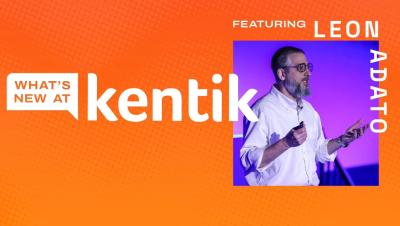
The latest News and Information on IT Networks and related technologies.
The times when it was enough to install an antivirus to protect yourself from hackers are long gone. We actually don’t hear much about viruses anymore. However, nowadays, there are many different, more internet-based threats. And unfortunately, you don’t need to be a million-dollar company to become a target of an attack. Hackers these days use automated scanners that search for vulnerable machines all over the internet. One such modern threat is a traffic analysis attack.
Load balancers play an important role in distributed computing. With load balancers, you can distribute heavy work loads across multiple resources, which allows you to scale horizontally. Since they are placed prior to computing resources, they need to endure heavy traffic and allocate it to the right resources fast. For this to happen, monitoring the health and performance of load balancers is key. In monitoring, visualization helps users to view various metrics quickly.
In monitoring, a target system or device is a deciding factor in designing your monitoring stack. You will have to consider various aspects starting from how you want to collect data in what frequency to how you want to surface metrics to end users. You will have to take this strategic approach when you want to monitor your network infrastructure. In this article, we will discuss how Grafana, an open-source visualization tool, can help you to monitor network switches.
Network monitoring is the practice of making sure the network as a whole, functions optimally by keeping a watch over all endpoints of a network, which is the heart of any business’s routine functioning. Any discrepancy in the form of a breach or slowdown could prove costly. Proactively monitoring networks helps administrators identify and prevent any potential issues that could occur at any time.