Operations | Monitoring | ITSM | DevOps | Cloud

The latest News and Information on Monitoring for Websites, Applications, APIs, Infrastructure, and other technologies.

Introducing... Progress WhatsUp Gold Free Edition

At Progress, we understand the challenges faced by IT teams in maintaining operational networks. Everything we do is to best serve those tasked with maintaining more seamless operations for an entire environment including network systems, servers, applications and services. We want to confirm that the greenest, first-day sysadmin can sit down in front of a product like Progress WhatsUp Gold and figure out how to use it in minutes.

What Is a HTTP Response? Guide To HTTP Response Status Codes

HTTP responses are an important part of web communication, letting servers respond to client requests with the requested data, status information, and other key details. This article will explain the structure and parts of an HTTP response, including the status line, headers, and body. We'll look at the different groups of HTTP status codes and their meanings, with real examples to show how they are used.

Efficiency Unleashed: Streamlining Workflows with the InfluxDB Management API

InfluxDB recently launched the InfluxDB Management API for InfluxDB Cloud Dedicated. Now, developers can manage databases, database tokens, and create database tables with custom partitioning directly from their application. The Management API provides a programmatic interface for performing tasks that previously required human interaction. This interface promotes easier workflows for applications that need automatic provisioning of multiple instances of InfluxDB, either for internal or external purposes.

How to Monitor Host Metrics with OpenTelemetry

Today's environments often present the challenge of collecting data from various sources, such as multi-cloud, hybrid on-premises/cloud, or both. Each cloud provider has its own tools that send data to their respective telemetry platforms. OpenTelemetry can monitor cloud VMs, on-premises VMs, and bare metal systems and send all data to a unified monitoring platform. This applies across multiple operating systems and vendors.

Address multi-client network traffic monitoring challenges with OpManager MSP's new NetFlow Analyzer integration

OpManager MSP has a new standout integration with NetFlow Analyzer. What does this integration mean for MSPs with bandwidth monitoring management? Network monitoring solutions are indispensable for MSPs as they enable proactive issue detection, enhance security, improve reliability and uptime, ensure scalability, and optimize cost efficiency for both MSPs and their clients.

Digitate ignio Cognitive Procurement Video

In today’s competitive procurement landscape, staying ahead means having a risk-free and resilient procurement function. Digitate’s ignio Cognitive Procurement offers an AI-powered solution that transforms your source-to-pay processes, ensuring savings, compliance, and risk mitigation. In this video, you will learn: How Digiate’s ignio provides 360° visibility and monitoring across all transactions.

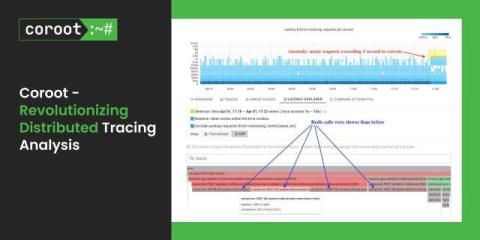
Coroot v1.0: Revolutionizing Distributed Tracing Analysis

We’re excited to announce Coroot v1.0 – our first stable version. It includes some great improvements, such as a new Distributed Tracing interface that takes troubleshooting to the next level. In this post, we’ll compare existing open-source distributed tracing tools, identify unsolved problems in the troubleshooting process, and see how Coroot can address them with its brand-new distributed tracing feature. These days, software is getting more complicated.

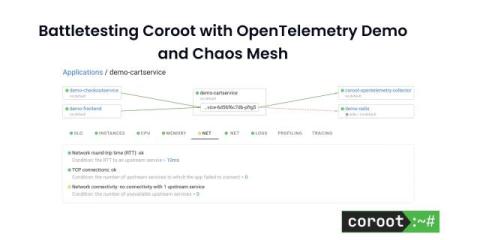
Battletesting Coroot with OpenTelemetry Demo and Chaos Mesh

The most effective method for evaluating an observability tool is to introduce a failure intentionally into a fairly complex system, and then observe how quickly the tool detects the root cause. We’ve built Coroot based on the belief that having high-quality telemetry data enables us to automatically pinpoint the root causes for over 80% of outages with precision. But you don’t have to take our word for it—put it to the test yourself!

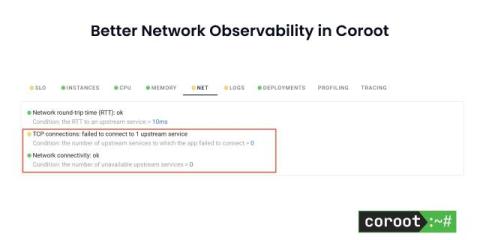
Better Network observability in Coroot

One service can’t connect to another (or can’t establish a database connection) – underneath this simple definition, there can be two very different conditions. First – we may have a service process down. In this case, the Kernel stack is operational, so we are getting the packet back, indicating the connection was refused. Second – when network flow is completely disrupted due to connectivity issues, firewall, or a node being completely down.