Operations | Monitoring | ITSM | DevOps | Cloud

The latest News and Information on Log Management, Log Analytics and related technologies.

AWS re:Invent Recap!

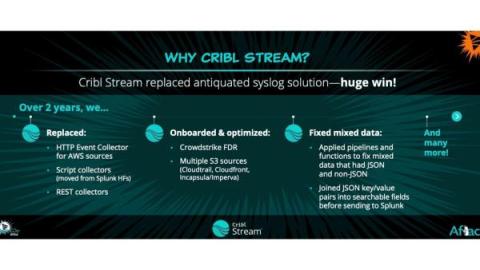
Cribl’s usual suspects, Ed Bailey and Jackie McGuire, are joined by Sr Partner Marketing Manager Michelle Zhang to discuss our experiences at AWS re:Invent this past November. It was a great event, and we want to share the top themes and presentations we saw at the show. Michelle will share her experience building and strengthening Cribl’s strategic alliance network and some of the "better together" progress made over the past year for customers.

[Webinar] Mastering log monitoring: Strategies for enhanced application failure troubleshooting

Are you fed up with web server failures or slowness? Are you struggling with an overwhelming amount of log data to analyze? Comprehensive log analysis offers complete visibility into your infrastructure, resulting in effective troubleshooting. This webinar helps you learn proven log monitoring techniques to tackle application failures and keep your systems running smoothly. In this session, we'll discuss: Analyzing large volumes of log data to detect issues and determine their causes Practical examples from real-world cases to hone your troubleshooting skills.

Understanding the difference between OpenSearch and Elasticsearch

Search is a fundamental requirement for anyone working with log files. When you have terabytes and petabytes of data, you need to find answers to questions – fast. The search engine that you choose sits as the cornerstone for any technology that helps you look for the information needed to answer questions. While OpenSearch and Elasticsearch may have similar beginnings, their modern iterations have significant differences.

OpenTelemetry Overview

Monitoring distributed systems means collecting data from various sources, including servers, containers, and applications. In large organizations, this data distribution makes it harder to get a single view of the performance of their entire system. OpenTelemetry helps you streamline your full-stack observability efforts by giving you a single, universal format for collecting and sending telemetry data. Thus, OpenTelemetry makes improving performance and troubleshooting issues easier for teams.

Enrichment: Better Data in for Better Response Times Out

In this conversation, Cribl’s Carley Rosato talks to Aflac’s Shawn Cannon about his role as a Threat Management Consultant, and how he manages their SIEM environment, brings in new data as needed, and works to improve the ingestion process. Our customers are always coming up with new and exciting ways to implement Cribl tools — importing a 34 million-row CSV file into Redis and enriching events in Splunk might be one of the most impressive we’ve seen so far.

My Recap on the Gartner IT Infrastructure, Operations & Cloud Strategies Conference

Last week, I attended the Gartner IT Infrastructure, Operations & Cloud Strategies Conference (IOCS). Gartner IOCS is my favorite conference every year because of the quality and level of the presentations. Gartner analysts deliver most sessions and put a lot of effort into the presentations and supporting research. ‍ I’d like to highlight two sessions that I found to be very informative.

Data Profiling The Secret Map of Your Telemetry Data Landscape

As data volumes proliferate and costs of data grow, it's becoming increasingly difficult to find the signal in all the noise. Telemetry data -- metrics, logs and traces -- are key to making sound, data-driven decisions, troubleshooting systems issues and maintaining uptime, but it's easy to get overwhelmed. Data profiling shows you exactly where your good data is coming from, how to save what's relevant and discard what's not and slash your data management and storage expenses.

AppSignal Expands Monitoring Capabilities with Vector

We're excited to announce AppSignal support for Vector logs and metrics! AppSignal's Vector support allows you to expand your monitoring horizons beyond our standard language integrations, making it possible to leverage AppSignal to both monitor the performance and manage the logs of components of your stack that fall outside a standard application. With Vector, you can use AppSignal to monitor how your databases and Kubernetes clusters perform and metrics from many other sources.