Operations | Monitoring | ITSM | DevOps | Cloud

How modern service operations drive fast resolution of IT issues

Managing technology services and operations can be like trying to jockey around road hazards in a vehicle that doesn’t have all the features you need for the drive. Just as your navigation technology helps keep your journey on track, full visibility into IT issues is vital. That’s what automated service operations offers. When different teams use different tools with different views of data, it can be a struggle to see if there’s a problem.

Automate Troubleshooting of Applications Running on Kubernetes

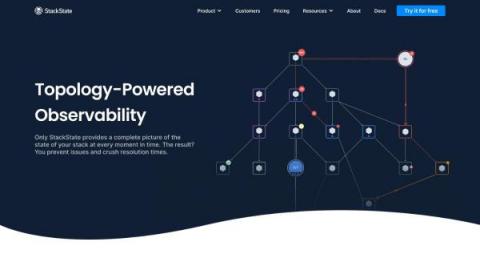
StackState is an out-of-the-box solution to observe your entire Kubernetes stack, identify problems, automatically highlight the changes that cause them and provide the full context you need for efficient and effective troubleshooting. Our clear and affordable pricing makes it easy to get started today.

Webinar: Making the case for AIOps

Over the past few years, artificial intelligence for IT Operations (AIOps) has risen in popularity within the technology landscape. It’s become a buzzword in the marketing world, and while there are many ways to define AIOps, the best way to start thinking about it is through the lens of outcomes, correlation and strategy—it’s all about the data.

Announcing issue-initiated Change Lead Time

Sleuth is pleased to announce a new option to start your Change Lead Time clock based on state transitions in your issue tracker! In our ongoing effort to meet customers where they are, we heard from many of you that you’d like Sleuth to account for and provide visibility into your pre-commit coding time. We’re pleased to offer this this new option to tell Sleuth which specific state transitions in your issue tracker should start your Change Lead Time clock!

New Honeycomb Integration With ServiceNow

Today, I’d like to tell you about a new community-contributed integration that connects Honeycomb to your ServiceNow workflows. My new integration reimagines what’s possible when connecting observability tools with ITSM systems. This post explains how it works and how to get started with it.

What is Observability: A Beginner's Guide

Observability is a methodology that you incorporate into your enterprise architecture to provide greater visibility into what is happening. It helps us determine the states of the system from their external outputs and allows technicians to identify bottlenecks, predict issues and mitigate them. As the architectures of IT systems are becoming more complex and distributed we use observability to meet the need to measure their internal states.

Share secrets with standalone projects with project context restrictions

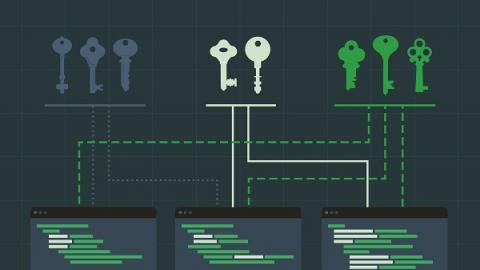
Introducing project context restrictions for GitLab organizations. This feature enables project-based restrictions on contexts for standalone projects that are not tied to a VCS. Standalone projects are available at this time only with a GitLab integration with CircleCI. In this blog post, we hope to explain the value of this feature and how it can be used to further secure your workflows.

Comprehensive Guide on Partitioning and Sharding in Azure Database for PostgreSQL

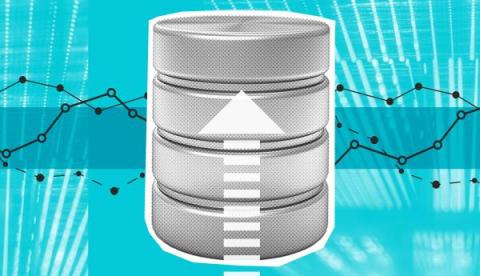
One of the biggest mistakes I’ve had to repeatedly help companies fix has been poor partitioning design. I’ve seen many database architectures designed in an attempt to make queries faster. While faster queries can be a product of implementing partitioning correctly for a given design, I’ve often seen query response times get much slower from implementing partitioning incorrectly for the database design.

Collect traces, logs, and custom metrics from your Google Cloud Run services with Datadog

Google Cloud Run is a managed platform for the deployment, management, and scaling of workloads using serverless containers. You can deploy workloads in the cloud or, using Cloud Run for Anthos, on your on-prem infrastructure.