Operations | Monitoring | ITSM | DevOps | Cloud

Latest Posts

Building an Intuitive Real-Time Interface for IT Ops Team Productivity

Few things damage productivity as much as waiting. The act of waiting forces us to context switch, disrupts our creative momentum, and eliminates our ability to experiment. Whether we are deploying a new service or troubleshooting a problem, waiting puts a heavy tax on team productivity in IT Operations.

Never postpone your product's security

If you ever (have to) ask yourself “When is the right time to address security issues?”, you’re already late to the party. Security isn’t that layer that you just add on top of your application before shipping it to production. Security is a mindset, that constant voice inside your head which asks “Is this safe?” each time you code something that pulls data out of storage or changes structures based on a user’s action.

Grafana Vs Graphite

The amount of data being generated today is unprecedented. In fact, more data has been created in the last 2 years, than in the entire history of the human race. With such volume, it’s crucial for companies to be able to harness their data in order to further their business goals. A big part of this is analyzing data and seeing trends, and this is where solutions such as Graphite and Grafana become critical.

Kubernetes run-time security: Automate Sysdig Falco deployment using Helm charts.

So, you want to implement run-time security in your Kubernetes cluster? If you are looking for an open-source tool, obviously Sysdig Falco is the way to go :). You can install Falco as a daemonSet, but as we wanted to make things even easier and natively integrated, we have packaged Falco as a Helm chart, the Kubernetes package manager.

Level Up With Derived Columns: Understanding Screen Size (With Basic Arithmetic)

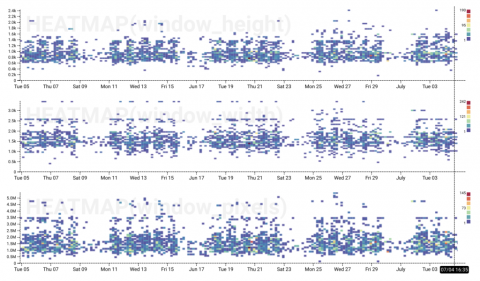
When we released derived columns last year, we already knew they were a powerful way to manipulate and explore data in Honeycomb, but we didn’t realize just how many different ways folks could use them. We use them all the time to improve our perspective when looking at data as we use Honeycomb internally, so we decided to share. So, in this series, Honeycombers share their favorite derived column use cases and explain how to achieve them.

You Can Improve Your Customer Satisfaction Charlie Brown!

What’s surprising to see today is how business operations struggle to get an integrated view of all business metrics. With greater volumes of data being collected, data analysts just can’t keep up with the pace. This state of affairs alone doesn’t hit as hard as the fact that many in data analytics have just come to accept this situation as a norm and simply bear with this daily struggle.