Operations | Monitoring | ITSM | DevOps | Cloud

How to get the optimal image size for web

If you’ve ever started a project to improve the load times for your website, web app, or mobile app, your heart is in the right place — but your efforts might not be. For many technology leaders, the first instinct is to blame code and infrastructure. They dive deep into optimizing front-end code, scale infrastructure resources, or migrate to a new type of database-as-a-service offering that promises to process requests a few milliseconds faster.

How Do You Manage A Multi-Platform Infrastructure Quickly and Efficiently?

Today, I would like to simplify the technical advantage that Nastel Technologies offers its clients. In a nutshell, Nastel is the leader in i2M (Integration Infrastructure Management) by managing a multi-middleware-platform infrastructure (MQ, Tibco, Kafka, Solace, …) from one interface.

10 tips for log shipping using Fluentd

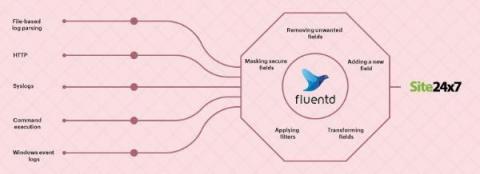
Fluentd is an open-source data collector that unifies data collection and consumption. It has different types of plugins that retrieve logs from external sources, parse them, and send them to log management tools like Site24x7 AppLogs. tail, forward, udp, tcp, http, syslog, exec, and windows_eventlog are common input plugins.

What is Server Management? Tools and Best Practices

In the digital age, organizations depend more on IT than ever before. The foundation of many IT functions -- including data storage, website hosting, emails, and software -- is server management. Without reliable, functioning servers, most IT functionality would collapse. Many businesses have migrated internal IT to cloud services using servers located in remote data centers, but a significant number still have in-house servers or use a hybrid environment of in-house and cloud services.

Atomic User Journeys

The temptation with synthetic user journeys is to create a single, long running journey that checks everything in one go and run it every 5 minutes. This may sound like a good idea because one journey is cheaper than five or because there’s fewer scripts to maintain, but it will make your life much harder and is likely to still cost as much due to the total time it takes to run. Therefore a good approach to user journey monitoring is to create atomic journeys.

5 Must-Have Preventive Maintenance Software Features

Maintenance is a very crucial part of all businesses in order to keep assets in good shape. Maintenance is utilized in various types as well. Proactive maintenance and reactive maintenance in this blog we will know more about proactive maintenance (preventive maintenance). Preventive maintenance is one of the most important factors for all organizations, especially when organizations are full of assets and pieces of equipment.

Kubernetes Tips: How to find the Port of a Service with a DNS request

Last week I created a guide for our users to set up an NGINX service as an API Gateway with Qovery. The API gateway must redirect the incoming traffic to the appropriate service with the correct port. My problem is that the API Gateway does not know the ports exposed for every service. In this post, I will show you a quick tip on finding the port of a Kubernetes service with a single DNS request. Let's go!

Difference Between Public, Private, and Hybrid Cloud

Cloud computing is vast. It encompasses a huge range of architectural styles, classifications, and types. This complex computing network has transformed the way we work and is a crucial part of our daily lives, both at home and at work. For organizations, there are many ways to “cloud”, but let’s start with the basics of cloud computing; the internet cloud.

Optimize your resource classes with the CircleCI resources dashboard

CircleCI cloud offers over 20 resource classes (varying CPU and RAM) across multiple execution environments. Finding the best resource class size for your job — not too big and not too small — can sometimes be a challenge. But now, you can view CPU and RAM usage for Docker executors within the UI. The new dashboard, found in the new Resources tab on the job details page, displays the CPU and RAM, for all parallel runs in your Docker job.