The latest News and Information on DevOps, CI/CD, Automation and related technologies.
The biggest challenge in this regard is that a lot of the infrastructure comes from different manufacturers. While these manufacturers provide solid solutions for monitoring their hardware, it can be very difficult to oversee the monitoring of all hardware. A hardware monitoring software with an integrated console can monitor all the hardware in the server ecosystem. Hardware monitoring should be an integral part of managing a server and infrastructure.
Site Reliability Engineering (SRE) is playing an increasingly pivotal role in supporting hybrid-cloud, DevOps environments, where Dev teams need to release updates fast and Ops need to avoid errors and failures in production. Powered by integrations to monitoring, orchestration, provisioning and ITSM tools, Interlink’s SRE solution brings improved understanding of where threats to the health of your IT services might lurk within DevOps workflows.
In recent times, Prometheus has become the standard for application monitoring in the tech space. But what exactly is Prometheus? Over the course of this article, we’ll touch on various subtopics to help answer this question, ranging from where it all started, to its architecture and how exactly it does monitoring. We'll address the various possible integrations/tools that can be used alongside Prometheus, and why Prometheus is a great tool for monitoring these platforms and applications.
In this article, you’ll learn the basics of MongoDB. We’ll cover its performance metrics, built-in monitoring commands, utilities and tools, and common monitoring strategies. You will also be introduced to a monitoring tool called MetricFire and provided with some examples of how it can be used in production systems together with setup instructions.
The reliability and stability of your services directly depend on how well you understand the state of your infrastructure and services. A great monitoring system will allow you to understand your infrastructure better. Monitoring the performance of your system allows you to not only fix current problems but also make changes to your infrastructure to avoid them in the future.
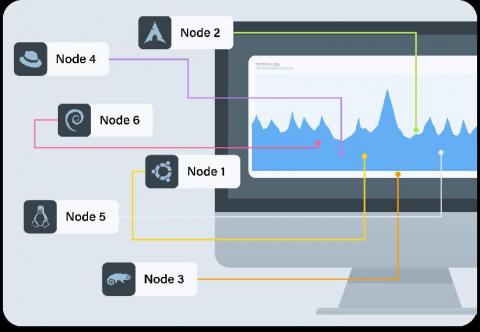
The Netdata Agent is well-equipped to solve monitoring and troubleshooting challenges for single nodes. We love that the Agent is so valuable to our users, but Netdata Cloud is designed for infrastructure monitoring. That’s why we’re working so hard to offer even more capabilities and help users monitor and troubleshoot infrastructures of all sizes, entirely for free!
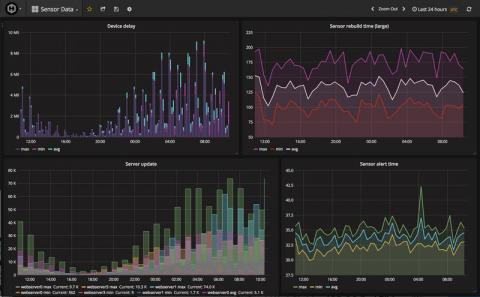
Prometheus and Grafana are powerful monitoring solutions. Combined together, you can build insightful monitoring metrics and display analysis on a beautiful dashboard. Among many external systems and applications, you can also monitor RabbitMQ with both toolkits. To integrate RabbitMQ into your Prometheus and Grafana, you can try MetricFire that provides hosted solutions for Prometheus and Grafana.