Operations | Monitoring | ITSM | DevOps | Cloud

The latest News and Information on Observabilty for complex systems and related technologies.

No more monkey-patching: Better observability with tracing channels

Almost every production application uses a number of different tools and libraries,whether that’s a library to communicate with a database, a cache, or frameworks like Nest.js or Nitro. To be able to observe what’s going on in production, application developers reach out for Application Performance Monitoring (APM) tools like Sentry. But there’s an inherent problem: the performance data that APM tools need is most often not coming natively from the libraries themselves.

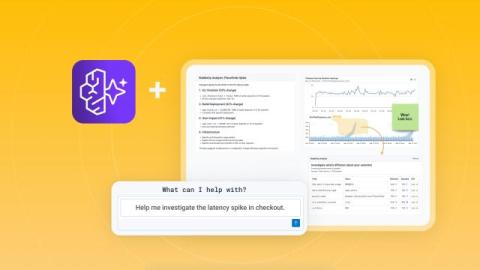
AI Observability in Grafana Cloud: A complete solution for monitoring your agentic workloads

The observability industry has developed great tools for using metrics, logs, traces, and profiles to monitor the cloud native applications that have dominated the last decade of software development. But when it comes to understanding what an AI system is actually doing, we’re often left reading raw conversations, guessing at quality, and reacting too late. And that’s a problem.

Fast AI Feedback Loops with Honeycomb and OpenTelemetry

Are you writing agentic applications, but aren’t sure what the agents are doing? Finding out too late that you've blown the budget with super expensive models? Not sure where the agents are failing, and feeling a loss of control? Could they do better? Observability is the visibility you need to get the job done. Sending telemetry to Honeycomb explains what your agents are actually doing.

How to solve key site reliability engineering challenges

Modern site reliability engineering challenges stem from the difficult requirement of confirming why complex systems fail in ways staging cannot replicate. While observability tools signal failures, and AI SREs reason over data, they leave observability gaps regarding the actual state of running code. By utilizing runtime context, teams capture live execution data to accelerate production debugging, resolving incidents in minutes without requiring manual redeploy cycles.

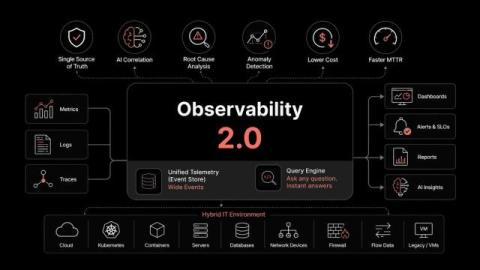
How Observability Powers Autonomous IT in Hybrid Environments

Autonomous IT only works when observability gives it the context to act with confidence. On any given day, a mid-size enterprise generates tens of thousands of alerts across on-prem infrastructure, multiple clouds, SaaS tools, Internet dependencies, and AI workloads. Most of them don’t need a human. A few of them do. Telling the difference, fast enough to matter, is exactly where IT teams are losing ground.

Uptrace MCP Server: Auto-Generate Dashboards with AI in Minutes

Tired of clicking through menus to build observability dashboards? In this video I walk through how to configure the Uptrace MCP (Model Context Protocol) server and connect it to an AI assistant so your dashboards get created automatically from natural-language prompts. You'll learn how to: By the end you'll have a working setup where describing what you want to monitor is enough to get a real, shareable dashboard in Uptrace.

Observability is a design problem: Live Laugh Logs ep. 1 - KubeCon Amsterdam 2026

What happens when 20,000 engineers descend on Amsterdam to talk about Kubernetes and AI? Welcome to Episode 1 of Live Laugh Logs, the podcast from Annie, Lewis and Andre from the Coralogix Developer Relations team where we will get together and recap everything going on in our worlds! We had an amazing time at KubeCon in Amsterdam and had loads of insights from the talks we went to around designing observability systems, all the AI tools being created and how to observe them, and using agent-generated code.

Building Audit-Ready Observability for Digital Banking

Most observability platforms are built to answer one question: what’s broken right now. Regulators are asking a different one: what happened, exactly, and can you prove it? Digital banking operates under constant regulatory scrutiny, where frameworks like DORA, PCI-DSS, and GDPR require every incident to be fully reconstructed across systems, timelines, and access. Systems can recover quickly, but the ability to explain what happened often remains fragmented across tools and teams.

Centralize observability management with Datadog Governance Console

As organizations grow, they face increasing difficulty in managing their observability efforts. More teams mean more dashboards, monitors, API keys, pipelines, and custom configurations. Without a centralized view, administrators spend hours chasing down untagged resources, investigating surprise bills, and revoking dormant credentials. Governance becomes a reactive effort to reduce waste and address issues, falling short of its potential to proactively create standards and optimize observability.