The latest News and Information on Monitoring for Websites, Applications, APIs, Infrastructure, and other technologies.
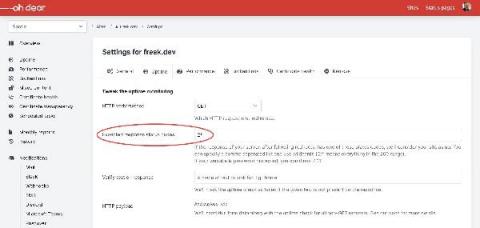
Keeping an eye on your site and sending you a notification when it goes down is one of the core features of Oh Dear. Under the hood, we'll send a request to your site and take a look if the response code is in the 200-299 range, which is the default response code range to indicate that everything is ok. Some of our users are monitoring password protected sites. In such cases, the web server might reply with status code 401 (unauthorised).
Delivering great performance and reliability for your critical applications just keeps getting harder, doesn’t it? Between microservices, mercurial cloud resources, containers spinning up and down, distributed teams, specialized teams, and developers making changes, it’s an increasingly complex environment. With so many moving parts, if something goes wrong, how do you know what happened where, and what your environment looked like at the precise moment the problem began?
Let’s check out together the features and improvements related to Pandora FMS new release: Pandora FMS 757.
Sampling is the practice of extracting a subset of data from a dataset to make conclusions about that larger dataset. It’s far from a perfect solution, but when it’s implemented with Refinery, Honeycomb’s trace-aware sampling proxy, sampling can help you manage very high volumes of complex event data.
We are excited to announce that Elastic Observability has earned the Enterprise Management Associates Top 3 Award for Observability in 2021, a recognition of our commitment to empowering customers with products and features that advance digital transformation and solve real-life problems. This award is driven by EMA’s exhaustive, quantitative research into the top challenges and use cases facing developers, DevOps, SREs, IT professionals, and business professionals.
To monitor your Elastic Stack with Elastic Cloud on Kubernetes (ECK), you can deploy Metricbeat and Filebeat to collect metrics and logs and send them to the monitoring cluster, as mentioned in this blog. However, this requires understanding and managing the complexity of Beats configuration and Kubernetes role-based access control (RBAC). Now, in ECK 1.7, the Elasticsearch and Kibana resources have been enhanced to let us specify a reference to a monitoring cluster.
It is no surprise that monitoring workloads are top of mind for many organizations to ensure a successful customer experience. As our applications become more distributed and cloud-native, we find that monitoring can become more complex. A single user transaction fans out to interact with tens or hundreds of microservices, each one requesting data from backend data stores or otherwise interacting with each other and other parts of your infrastructure.
The Nexthink team is excited to announce that we have been recognized in the September 2021, Peer Insights ‘Voice of the Customer’ report. Customers submitted over 150 reviews with an overall star rating of 4.6 (out of 5) and an impressive 4.7 rating (out of 5) for ‘Support Experience’ as of July 2021. Our team at Nexthink takes great pride in this distinction, as customer feedback continues to shape our products and services.