What's New Pandora FMS 758
Let’s check out together the features and improvements related to the new Pandora FMS release: Pandora FMS 758. Remember this is an LTS version, we only have two of them a year, in April and November and they are stable.


The latest News and Information on Monitoring for Websites, Applications, APIs, Infrastructure, and other technologies.
Let’s check out together the features and improvements related to the new Pandora FMS release: Pandora FMS 758. Remember this is an LTS version, we only have two of them a year, in April and November and they are stable.
From September to early October, Honeycomb declared five public incidents. Internally, the whole month was part of a broader operational burden, where over 20 different issues interrupted normal work. A fraction of them had noticeable public impact, but most of the operational work was invisible. Because we’re all about helping everyone learn from our experiences, we decided to share the behind-the-scenes look of what happened.
Business leaders talk excitedly about "digital transformation" and "innovative customer experience," but it falls on the shoulders of IT operations to make sure everything actually works. As transformation takes hold, IT teams manage increasingly complex, hybrid, and distributed environments – often comprising traditional on-premises systems and modern infrastructures made up of containers, multiple clouds, and virtualized networks.
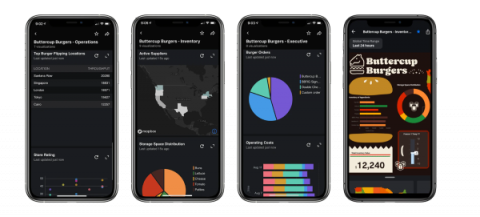
Are you ready to unlock value from your Splunk data, anywhere at any time? You might be itching to do this after seeing the amazing announcements made by the Splunk Connected Experiences team at.conf21. For those that might have missed it — or those that are hoping to learn more — we’ve rounded up the highlights below. Across each of the products, the takeaway is clear: we’re continuing to make it easier than ever to access your Splunk data in new and innovative ways.
When it comes to comparing all of the best solutions for log management and analysis it can be incredibly difficult to compare key features and pricing per annum side by side to see what solutions you should consider trialling.
Cloud infrastructures have introduced increasing levels of complexity—you have to manage workloads across on-premises, private, and multiple public cloud environments. This requires you to migrate efficiently, optimize effectively, and stay rightsized on an ongoing basis, all while meeting evolving business requirements. With so many moving parts, it can be a massive challenge with lots of pitfalls that can cost you time and money and even put your business results in jeopardy.
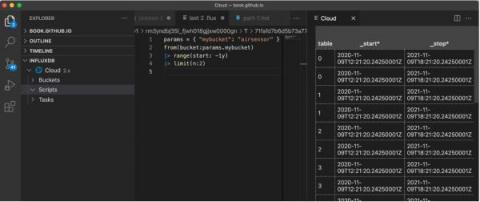
If you’re familiar with InfluxDB Cloud, then you’re probably familiar with Flux already. Flux enables you to transform your data in any way you need and write custom tasks, checks, and notification rules. But what you might not know is that InfluxDB Cloud now supports API Invokable Scripts in Flux.
Your IT infrastructure runs on servers, which makes them vital to the performance of your entire IT environment. therefore, it is essential to monitor your servers to ensure there isn’t any disruption in performance and uptime. Servers are devices or applications that can store, process and deploy resources to other devices, applications or users. Now that you know how important servers are to an IT environment, what happens if a server stops working?
Today, we are launching a new Grafana Labs product, Grafana Enterprise Traces. Powered by Grafana Tempo, our open source distributed tracing backend,.and built by the maintainers of the project, this offering is an exciting addition to our growing self-managed observability stack tailored for enterprises.
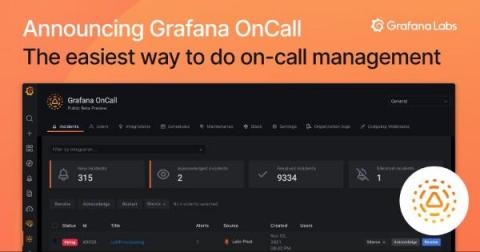
A critical part of managing modern software development is setting up and running an on-call rotation. But that often involves significant toil, in part because many of the existing tools are cumbersome and not developer-friendly. That’s why we’re excited to announce Grafana OnCall, an easy-to-use on-call management tool that will help reduce toil in on-call management through simpler workflows and interfaces tailored for devs.