Operations | Monitoring | ITSM | DevOps | Cloud


The latest News and Information on Monitoring for Websites, Applications, APIs, Infrastructure, and other technologies.
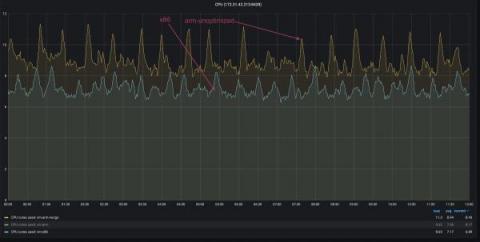
Running VictoriaMetrics on ARM-based processors
ARM processors become more popular and more cost-effective according to many benchmarks. One of them was made by Percona for MySQL. Some of our users reported issues with VictoriaMetrics at AWS Graviton instances. The main concerns were higher CPU and disk IO usage compared to x86 instances of the same size and for the same workload. By that time, we verified that VictoriaMetrics works fine for raspberry and IoT devices, but didn’t do any optimizations for ARM builds.

What Is Log Retention?

The Virtual Experience: 3 Future-Facing VDI Use Cases
In today’s world of flexible work, technology has to be one thing above all else: versatile. A decade ago, virtual desktop infrastructures (VDI) wouldn’t have been able to meet this moment – VDI used to be too narrow and restricted in terms of what use cases it could service. Fortunately, VDI has evolved dramatically since those days. Now, with the right resources, there’s very little you can’t accomplish through virtual desktops.

Observability, monitoring and supervision
There are different positions on whether observability and monitoring are two sides of the same coin. We will analyze and explain what the observability of a system is, what it has to do with monitoring and why it is important to understand the differences between the two.

Introducing New Storage Dashboards in the Cloud Monitoring Console (CMC)
Monitoring and gaining additional insights about usage of your Splunk Cloud Platform deployment is essential for effective management as a Splunk admin. Your Splunk Cloud comes with the Cloud Monitoring Console (CMC) app, which displays relevant information about the status of your Splunk Cloud environment using pre-built dashboards.
Dashboard Fridays: Log Analytics VM Updates

Analyzing ESG Survey: Observability from Code to Cloud
Big Data Platform (BDP) Replacement Through Splunk: https://conf.splunk.com/watch/conf-online.html
## Follow Cribl