Operations | Monitoring | ITSM | DevOps | Cloud

The latest News and Information on Monitoring for Websites, Applications, APIs, Infrastructure, and other technologies.

Elevate Your IT Service Offering with an Official Icinga Partnership

In the dynamic landscape of IT services, staying ahead of the curve is not just a strategy but a necessity. For IT service providers already consulting clients on monitoring solutions, taking the next step to engage in an official partnership with Icinga can be a transformative move. Let’s explore the reasons why such a partnership can elevate your service offering and provide substantial benefits for both your business and your clients.


A Guide to Predictive Maintenance & Machine Learning

Various economic pressures on businesses have created a focus on new and innovative ways to manage operational costs. At the same time, businesses are looking at using IT to help manage overall business costs and increase income—for example, by supporting remote working, and in many cases, enabling e-commerce to replace closed retail outlets. Management of infrastructure to minimize downtime has two major benefits: reductions in support and maintenance costs and improvements in service levels.

AVD Monitoring for MSPs (Managed Service Providers)

AVD (Azure Virtual Desktop) has grown in popularity and for many reasons many organizations are choosing to consume AVD via a specialist Managed Service Provider (MSP). For the MSPs offering AVD, monitoring and troubleshooting AVD especially for multi-tenant environments is challenging and involves significant, costly and skilled effort using native tools such as Azure Insights or Azure Monitor.

Grafana Agent v0.38 release: new OpenTelemetry components, configuration improvements, and more

Grafana Agent v0.38 has hit the digital shelves just before the holiday season! 🧑‍🎄 The elves over at Grafana Labs have been quietly working on Grafana Agent, with more than 50 updates for all SREs and developers to use — no matter if you’re on the naughty or nice list. This includes new features, improvements, bug fixes, and significant ease-of-use changes.

DevAlert 2.0 Now Available

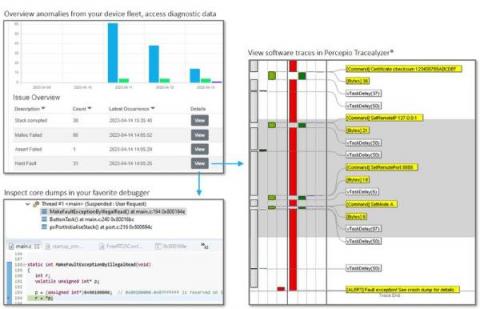
DevAlert 2.0, which is now immediately available from Percepio, is a major upgrade to our edge observability platform. The upgrade provides much improved diagnostic capabilities, including core dumps for Arm Cortex-M devices. This allows remote inspection of crashes, errors or security anomalies in full detail, including the function call stack, parameters and variables and with source code display.

Top Providers for Vendor Status Pages

Today, businesses are heavily reliant on online systems and platforms. But how would you communicate with users if you encounter downtime or an incident? This is where a status page comes in. A status page acts as a real-time communication hub, providing updates on system status, incidents, and maintenance activities. What’s even better is that you can find tons of free, self-hosted, and open-source status page systems to choose from online.

On-premise vs SaaS: Which Network Monitoring Tool You Should Choose?

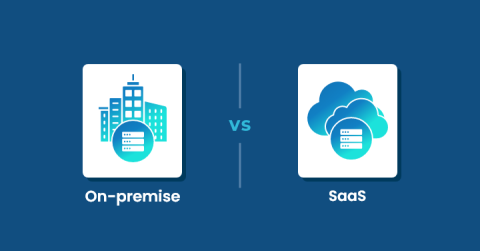
On-premise or SaaS network monitoring tool: which one to choose? This question has been bugging many businesses for quite a few years now. And no matter how much I hate to say it but the answer to this burning question is — it depends. Yes, it depends on several factors. In this blog, we will list all those factors that you should keep in mind before making this decision.

Gartner IOCS replay: Achieving unified observability with data mesh

The single pane of glass is perhaps the most enduring and elusive goal of enterprise IT operations teams. When we polled our customers a couple of years ago, out of 184 respondents, 99% of them rated it as important to their business – with 64% indicating “extremely important”. The shared dream is to have: But unfortunately, the single pane of glass has become a bit of myth.

Using the Cribl Redux Stats Pack

Cribl’s internal metrics are very handy for seeing what Cribl is doing. And while there are many data points related to input vs output volumes, sometimes you need more control over what you’re tracking. This pack allows you to route arbitrarily defined traffic through a stats tracker to capture changes in event count and volume. Perhaps you are onboarding a new host, or trialing a new Pipeline.