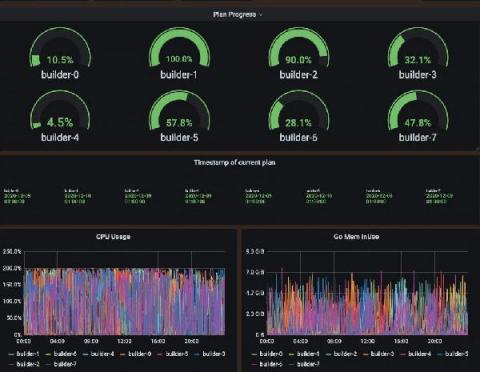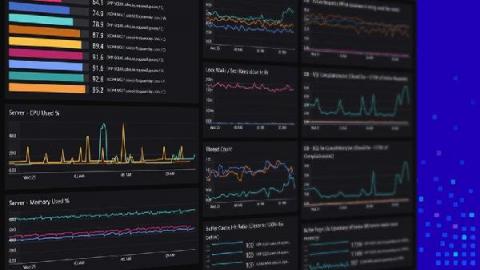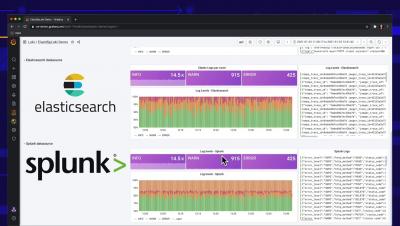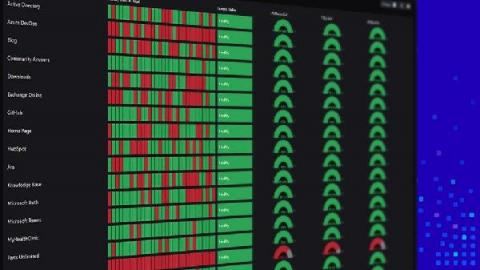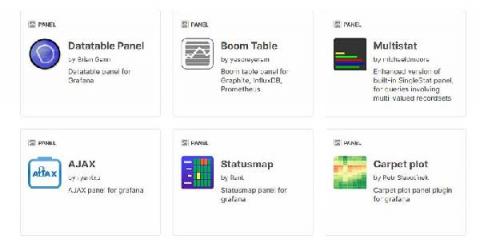
Monitoring information that matters to you will often come from disparate sources – whether you are a server engineer, a SQL database administrator, or an application owner wanting a 360 view of your applications’ health. For example, you may want to visualise your server metrics from SCOM alongside historical trends from the SCOM Data Warehouse.
Over the past four days, Grafana Labs' ObservabilityCON 2020 brought together the Grafana community for talks dedicated to observability. We hope you enjoyed all of the sessions, which are available on demand now. (Link to them from the schedule on the event page). The conference wrapped up with predictions and advice from observability experts, lessons in failure, and Grafana Labs team members showcasing ways Grafana and other tools fit into an observability workflow.
Today is the last day of ObservabilityCON 2020! We hope you’ve had the chance to catch the talks so far, and will tune in live for today’s sessions. View the full schedule on the event page, and for additional information on viewing, participate in Q&As, and more, check out our quick guide to getting the most out of ObservabilityCON. If you aren’t up-to-date on the presentations so far, here’s a recap of day three of the conference.
Grafana v7.3 has been released! With Grafana 7.0, we rounded out our observability story by making tracing a first-class citizen in Grafana alongside metrics and logs. That release included integrations with Jaeger and Zipkin, and earlier this month, we announced our integration with AWS X-Ray. At ObservabilityCON on Monday, we announced Grafana Tempo, our new open source distributed tracing system. Tempo is massively scalable, cost-effective, and easy to operate.
ObservabilityCON 2020 is live! This week Grafana Labs is bringing together the Grafana community for talks dedicated to observability. We hope you’re able to catch the great sessions we have planned. You can find the full schedule on the event page, and for additional information on viewing, participating in Q&As, and more, check out our quick guide to getting the most out of ObservabilityCON. Day 2 was dedicated to all things Prometheus — featuring new solutions and in-depth case studies.
Let’s talk through a scenario: You have a Linux-based VM running on DigitalOcean (aka a Droplet), and you install Netdata on it using our recommended kickstart script. As the installation process winds down, the Droplet starts up the Netdata Agent’s web server and serves the local Agent web dashboard on port 19999.
When troubleshooting a SQL Server issue, you don’t need all of those single-use dashboards in the SCOM console. You really only need one interactive diagram to help you identify the root cause in a few clicks – and SquaredUp’s Visual Application Discovery and Analysis (VADA) tool is just that. With this tool, you can also quickly and easily look at all of the servers that make up an application.