Operations | Monitoring | ITSM | DevOps | Cloud

Path to OTel Code Owner: Lessons from otelhttp (Grafana OpenTelemetry Community Call #10)

In this episode of the Grafana OTel Community Call, we're joined by Sonal Gaud, code owner of otelhttp on opentelemetry-go-contrib. We'll trace her path from writing test-coverage PRs to owning the instrumentation library that most Go services use to get HTTP traces and metrics for free — and go deep on how otelhttp actually works under the hood: context propagation, metrics/attributes via the Labeler, route cardinality, and how the library evolves alongside HTTP semantic conventions.

What is the Grafana Knowledge Graph and How Does It Help AI Agents? (Demo)

Grafana's Knowledge Graph builds a contextual layer on top of your telemetry data, automatically extracting entities and relationships so you can see how your services actually connect. In this deep dive, Jia show how it powers root-cause investigation both in the Grafana UI and through agentic workflows using gcx and Claude Code. Learn more about Grafana's observability tools and try Knowledge Graph for your own telemetry data at grafana.com.

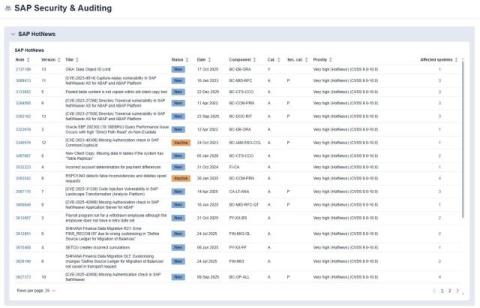
Security KPI Dashboards for SAP Operations Teams

An Avantra SAP security dashboard gives SAP operations teams one view of SAP security KPIs, covering SAP Notes and HotNews status, system hardening, user access risk, and audit compliance across on-premises, hyperscaler, and RISE with SAP systems. Security teams have their own tools: a SIEM, a SOC console, vulnerability scanners. SAP operations teams usually don’t.

Grafana Campfire - What's New in Grafana Git Sync - (Grafana Community Call - Sept 2026)

Join us for a follow-up Grafana Campfire to explore what we’ve built in Git Sync since December 2025. We’ll cover new and improved Git provider integrations and authentication options, smoother dashboard editing and pull request workflows, and more control over changes through signed commits, user attribution, and PR and commit conventions. We’ll also explore improvements to folder organization and permissions, READMEs alongside your dashboards, and clearer synchronization status.

What if your agent's hallucinations had a budget? How to start using SLOs for agent behavior

At Grafana Labs, observability is what we do. So as we started building AI agents, we naturally reached for the same instincts we bring to every system: measure it, set targets, and make reliability something you can reason about instead of hope for. That instinct led us somewhere unexpectedly useful. It turns out one of the oldest ideas in reliability engineering, the error budget, maps beautifully onto one of the newest problems in software: how do you know if an AI agent is actually any good?

Visualize Data Your Way, with Intelligence Dashboards Built for Your Stack

When something goes wrong in production, you do not want to spend the first five minutes rearranging charts. You want the error rate, throughput, queue depth, memory, and view metrics that show when customers are having issues while using your app.

Grafana Alerting: Scale alert routing without scaling complexity using multiple notification policies

Alert routing often starts simple. A team creates a few contact points, adds some label matchers, and builds a notification policy tree that sends each alert to the right destination. But alerting configurations rarely stay simple. As an organization grows, its notification policy tree must accommodate more teams, services, and routing requirements. Changes for one team still require editing a global configuration, making ownership less clear and independent provisioning harder.

Digital Experience Monitoring with Grafana Cloud: Session Replay, synthetic checks, and faster investigations

When something breaks in production, the questions that matter most are also the toughest to answer from metrics alone: who was affected, what did they actually see, and is this worth waking someone up for? Answering those questions requires a fuller picture of the issue and its impact on your users. That’s where Digital Experience Monitoring (DEM) in Grafana Cloud comes in.

Custom labels in Grafana Cloud Synthetic Monitoring: New updates for consistency and ease-of-use

Labels are a powerful way to organize telemetry and define policies across Grafana Cloud, helping to streamline alerting, attribution, access control, and more. But traditionally, custom labels in Synthetic Monitoring have worked a little differently: they only lived on a single sm_check_info metric, and Grafana Cloud prefixed each one with label_.

Grafana Tempo + Pyroscope: Profiles Traces (Sept 2026 Community Call )

Profiles + Traces and span redaction Can't comment in the chat? You may need to create a channel. Join us live for an introduction to flame graphs. We’ll cover what they are, how to read them, and how to use them to find performance bottlenecks in your applications. Bring your questions! Grafana Cloud is the easiest way to get started with Grafana dashboards, metrics, logs, traces, and profiles. Our forever-free tier includes access to 10k metrics, 50GB logs, 50GB traces and more.

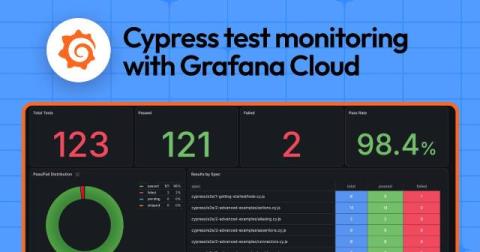
How to monitor Cypress tests with Grafana Cloud

If your Cypress suite has tests that fail more often or run slower, you know it can be hard to figure out the pattern from a single job. It could be one spec that slowed down, or a single test that fails, or maybe the entire suite is trending slower. The root cause could be a bug in the app, or a flaky test, or something else.

I use Claude every day. I still build dashboards in SquaredUp

If you've looked at SquaredUp and thought "I don't need this, I'll just use Claude", I understand completely. I've thought it too. Here's what changed my mind. I use Claude constantly. I've also spent the last few months building the parts of SquaredUp that let it in: our MCP server, the object graph and correlation, a stack of plugins. So this isn't a dashboard vendor being sniffy about AI. I've watched Claude pull from several sources and produce something genuinely useful in under a minute.

How to use Grafana auto grid dashboard option for flexible layout across devices

Learn how to use the auto-grid option, a flexible panel layout that adapts to varying screen sizes and dynamic content. Creators can now define the max number of columns or max height of panels, making dashboard layouts more responsive and maintainable.