Operations | Monitoring | ITSM | DevOps | Cloud

The best ways to visualize API responses in 2026

APIs power almost everything we use today, from cloud platforms and monitoring tools to ticketing systems and internal applications. But no matter how useful an API is, the response usually arrives as raw JSON. That's perfectly fine for machines, but much less convenient for people. Whether you're debugging an endpoint, exploring a new service, or building dashboards for your team, you'll probably want a better way to visualize that data. Fortunately, there are several ways to visualize API responses.
Agent Observability Deep Dive Demo | Grafana Cloud

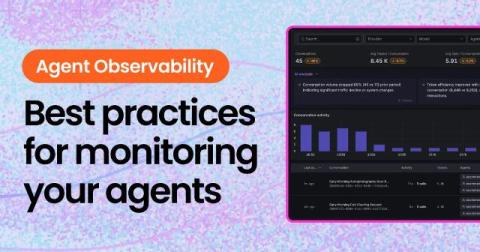
Grafana AI Observability is our new database and platform for observing AI Agents. Over the past year at Grafana Labs, we built Agents and we needed a way to understand how they are performing, what are the costs associated with them, what's the error rate or time to the first token as well as how they are behaving. Grafana Staff Engineer, Ivana Hučková provides a deep dive demo on how Grafana AI Observability connects our experience building Agents with our experience building observability systems.

Dashboards aren't (quite) dead

Historically, non-technical stakeholders would’ve had most of their data questions answered either through pre-built dashboards or by asking their Data team (or equivalent). Self-serve analytics tools went a step further by offering safe, governed datasets built by Data teams which let non-technical users dig into data without having to worry about how it joins together, how metrics like “revenue” are defined, and so on.

Run tests using natural language with k6 Agentic Testing

In this video, our Senior Director for AI Engineering, Mat Ryer, issues a challenge: Can k6 agentic testing in Grafana Cloud be instructed at a high level to just beat Wordle? Staff Software Engineer Joan López de la Franca Beltran sets up that scenario using agentic testing (currently experimental), yielding some surprising results.

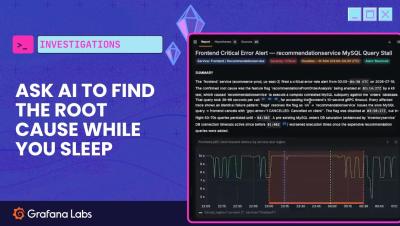
Automatically starting investigations from an alert with Assistant Investigations

Staff Software Engineer Alexander Sniffin demonstrates how you can use Assistant Investigations to automatically start an investigation for you when an alert fires in Grafana. When you receive an alert, Investigations can do the work to figure out the root cause so that you don't have to spend your time doing so. Assistant Investigations is now generally available for Grafana Cloud.

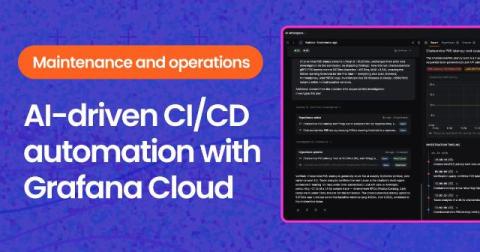
Automate all the things: How to use Grafana Cloud's AI to relieve the operational burden

Continuous integration and continuous delivery (CI/CD) have dramatically changed how we ship software. But once code reaches production, the operational work is still surprisingly manual. Engineers continually monitor systems, investigate unexpected behavior, and decide which issues require action. And that is where the next opportunity for AI-driven automation lies. For example, in today's CI/CD workflows, someone refreshes the pipeline page to see whether the queue has moved.

Our 3-month AI roadmap - the future of smart dashboards

AI is set to transform our technology landscape. For many of us working in software, it already has — developers are now writing more code, building more features, and deploying more applications, faster. For the teams supporting IT and software services that means more applications to support, across a greater breadth of technologies, and with more complexity (that is probably less well understood by the developers who created it). Your operational tooling needs to keep pace.

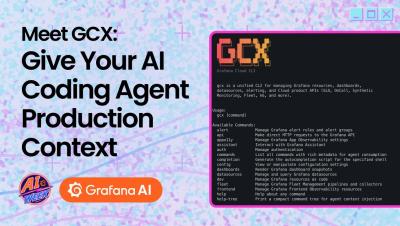
Meet GCX: Give Your AI Coding Agent Production Context

Your AI agents are only as good as the context it has. Without access to what's happening in production, it can only make educated guesses. Chapters: In this video, you'll meet GCX. The bridge between AI coding agents like Claude Code, Codex, Cursor, and your Grafana observability stack. You will learn how GCX securely gives AI agents access to metrics, logs, traces, dashboards, and other production telemetry so they can investigate issues, answer questions, and help you debug with real operational context.
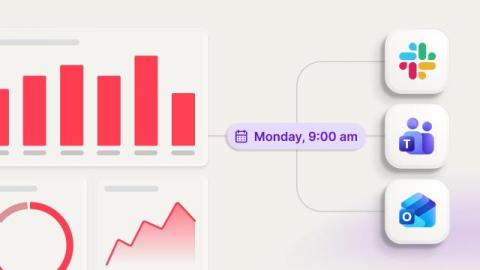
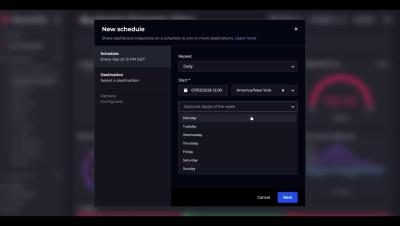
Scheduled Sharing in SquaredUp

Getting your dashboards in the right hands is vital for many teams. This typically means that someone has to remember to check them, and that rarely happens consistently. Stakeholders miss weekly updates, managers ask for reports that already exist, and your carefully-built dashboards sit unread while people wait for someone to send them a screenshot. Scheduled sharing is the frictionless feature that solves this issue.
Smarter onboarding and planning with Grafana Assistant: How to ensure observability is baked in from the start

It's Monday afternoon and that feature you've been working on is mostly done. There's just one item still sitting untouched at the bottom of the ticket: "Add monitoring." You know you should. You also know the sprint ends tomorrow, nobody on the team is an observability expert, and figuring out what to measure—let alone how to write the PromQL for it—feels like a project all on its own. So it gets the same treatment it always does: "We'll add it when it breaks.".

Explore what's next in agentic operations: Introducing AI Week

Observability has traditionally been tacked on after your code hits production, but with agentic operations on the rise, that's no longer sustainable. Agents have dramatically increased the rate of change as they write more code, ship more changes, and operate more systems—all at a speed that compounds scale and complexity.

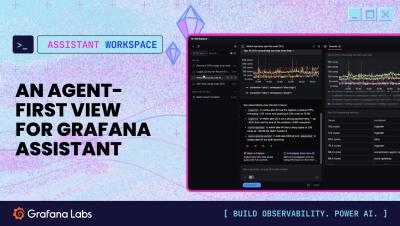
Meet Assistant Workspace: Full-page experience for Grafana Assistant

Introducing Assistant Workspace, a full-page surface for Grafana Assistant, built for the conversations that outgrow a sidebar. Dig into longer investigations, compare data side by side, and keep your train of thought in one place — then turn what you find into a dashboard without starting over. When a quick question becomes a real investigation, open it in Workspace and keep going. In this video, Ed Poole gives us a demo of how to use Workspace, including the use of canvases to see more information than before.

OpenTelemetry eBPF Instrumentation (Grafana OTel Community Call #9)

In this episode of the Grafana OTel Community Call, we're exploring OpenTelemetry eBPF Instrumentation (OBI). OpenTelemetry eBPF Instrumentation (OBI) offers a powerful way to instrument applications at the system kernel level, capturing essential “RED metrics” — request rate, error rate, and duration — and network flows without requiring code changes, rebuilds, or redeployments. We will cover the project's architecture, discuss its origins as Grafana Beyla, and look ahead to the roadmap for language and runtime coverage.

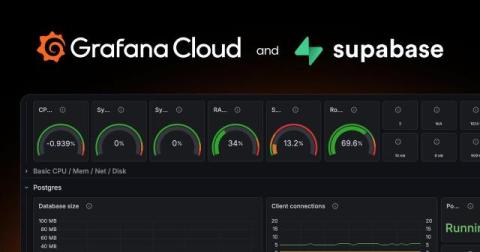
How to monitor your Supabase projects: connect Grafana Cloud in one click

As AI agents accelerate software development and spin up applications at scale, visibility into what's happening behind the scenes, including query performance and database health, has never been more important. Gaining that level of insight requires observability that can keep pace.

A new allowlists design for Grafana Cloud IP addresses: What you need to know

If your network restricts inbound or outbound traffic, you likely maintain an allowlist of Grafana Cloud IP addresses so your systems and Grafana Cloud can talk to each other. Today we're introducing a new allowlists design: a single, structured API that replaces the collection of per-product lists we've published until now. If you don't use IP allowlisting—or you connect to Grafana Cloud over private connectivity such as AWS PrivateLink—nothing changes for you, and no action is needed.

Power BI vs. SquaredUp: Which is right for IT teams?

At first glance, Power BI and SquaredUp both look like dashboarding tools. In practice, they solve different problems. SquaredUp serves engineering teams and IT teams, including SREs, DevOps engineers, engineering managers, and technology leaders. It connects to monitoring, cloud, DevOps, and ITSM platforms. This gives teams a real-time insights into service health, performance, and key metrics in one place. Power BI is Microsoft's business intelligence platform, designed for analysts and business teams.

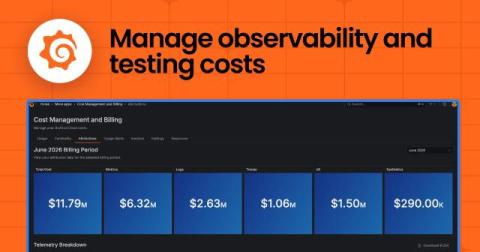
Cost attribution in Grafana Cloud: Manage spend across observability and testing workflows

Knowing what you're spending on observability is useful. Knowing which team, service, or project is driving that spend is what actually lets you act on that information. Cost attribution is a core part of how Grafana Cloud approaches cost management and optimization.

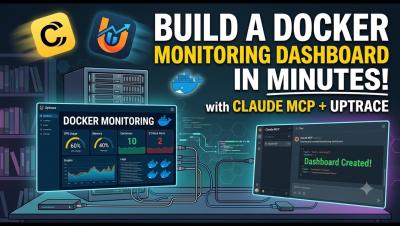
Build a Docker Monitoring Dashboard in Minutes with Claude MCP + Uptrace

In this video, we use Claude MCP to create and merge Docker container dashboards in Uptrace — directly from the terminal, no manual clicking required. What you'll see: CPU, memory, network, and disk I/O dashboards created with plain text prompts Two dashboards merged into one unified view Dashboard exported as YAML for version control.

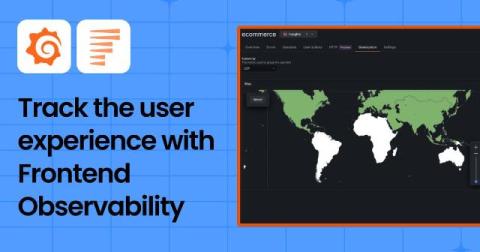
Beyond performance monitoring: Understand the user experience with Grafana Cloud Frontend Observability

You've optimized your Largest Contentful Paint. Your Time to First Byte is under 200ms. Your Lighthouse scores are green. And yet, your checkout conversion rate is quietly dropping. A segment of users in Southeast Asia is churning. Your support team is fielding tickets about a form that "just doesn't work" and you have no idea which one. Traditional frontend performance monitoring tells you whether your application is fast. It doesn't tell you whether people are actually succeeding when using it.

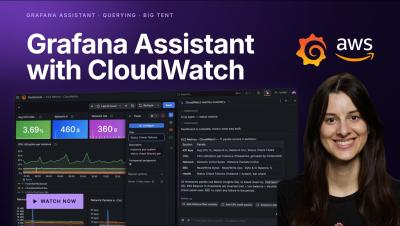
How to use Grafana Assistant with the AWS CloudWatch data source

Grafana Assistant meets AWS CloudWatch! In this video, Staff Software Engineer Ivana Huckova shows how to use Grafana Assistant, the AI agent built into Grafana Cloud, with the Amazon CloudWatch data source. Watch her query CloudWatch metrics and logs in plain language, build dashboards in seconds, and troubleshoot AWS resources — no query syntax required.

Webinar: Halo & SquaredUp - Dashboards that deliver

SquaredUp and Halo teamed up for a live webinar exploring why visibility matters, the reporting challenges many organisations face, and how HaloPSA data can be transformed into engaging dashboards using SquaredUp. We also heard from a customer on how they're using dashboards to manage costs and improve service delivery. Whether your goal is sharper reporting, greater visibility for customers, or a clearer demonstration of the value your services deliver, this session offers practical insights and real-world examples to help you get there.

Getting started with Huntress dashboards

If you run Huntress across a fleet of client environments, you already know the console gives you a solid view of agent health, threat detections and incident reports. What it doesn't give you is a way to put that data next to everything else you're tracking, your PSA tickets, your other security tools, the rest of your stack, so you can see the whole client picture in one place.

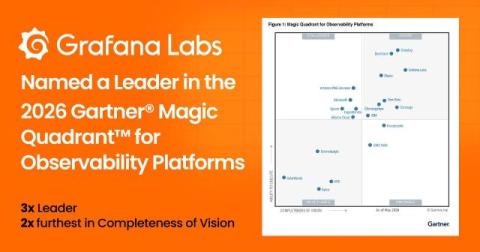
Grafana Labs named a Leader again in the 2026 Gartner Magic Quadrant for Observability Platforms

We’re delighted to share that Grafana Labs has been named a Leader in the Gartner Magic Quadrant for Observability Platforms for the third consecutive year. Notably, we’re also positioned furthest in “Completeness of Vision” for the second year in a row.

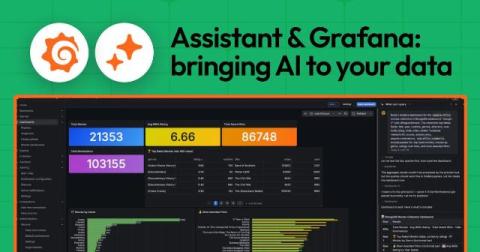
Stop switching tools to find answers: Grafana Assistant now works across 30+ data sources

When you're the on-call engineer and something breaks, you can quickly find yourself deep in a series of tools you don't regularly use—switching tabs, copying query results, and manually stitching together a picture of what's happening and why. People are increasingly turning to AI to get around this, but the results can be a mixed bag.

From AIOps to SEO Ops: How AI Automation Is Making Organic Growth More Observable

Modern technical teams have learned a clear lesson from DevOps, SRE, and AIOps: complex systems cannot be managed well if they are invisible. Applications need logs, metrics, traces, alerts, and feedback loops. Cloud infrastructure needs monitoring. Incident response needs context. Automation is most useful when it does not simply perform tasks, but helps teams understand what is happening, what needs attention, and what should happen next.

Building an end-to-end reliability testing strategy with Grafana Cloud

Modern applications can fail in many different ways, from performance regressions and frontend errors to systems that break under heavy load. Because no single testing or monitoring approach can catch every type of failure, effective reliability testing requires multiple layers that validate your application before, during, and after their release.

The AI Software Engineering Revolution, feat. Anthropic | Big Tent S3E9

In this episode of Grafana's Big Tent, hosts Mat Ryer (Senior Director of AI, Grafana Labs) and Tom Wilkie (CTO, Grafana Labs) sit down with Eric Burns, Field Executive Architect at Anthropic, to talk about building trust between tech and business execs, why Anthropic bet early on running across every major cloud, and what it was like watching large language models go from "interesting" to "obviously the future" in real time.

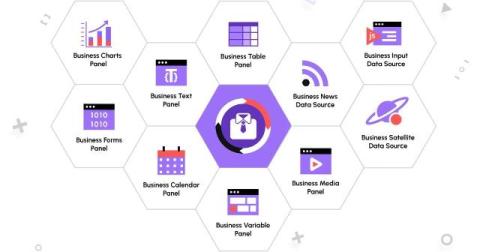
Business intelligence plugins for Grafana: A support update

In January, we announced that Grafana Labs had assumed maintenance of the business intelligence (BI) plugins created by Volkov Labs, and committed to a six-month maintenance period. Today, we’re sharing an update: we're extending our maintenance commitment through the end of 2026. As announced earlier this year, that commitment includes maintaining compatibility with recent Grafana releases while handling bug fixes, security updates, and community contributions on a best-effort basis.

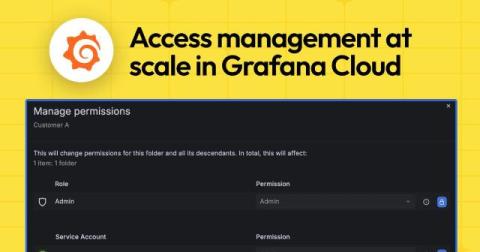
How to scale access control in Grafana Cloud

One of the primary reasons organizations adopt Grafana Cloud is to create a single pane of glass across the data they collect from self-hosted systems, cloud providers, and third-party platforms. Bringing those signals together enables richer correlations, reduces tool sprawl, and makes it easier for teams to understand what's happening across their environment. But as observability grows and becomes more centralized, access management becomes more important.

Designing the New Workloads Dashboard for Rancher

To meet community demand, we have restored the global workload overview in Rancher Manager. After previously removing the feature due to performance constraints, we prioritized user feedback and rebuilt it from the ground up. Powered by a new, optimized API, the updated UI is both highly scalable and resilient.