Operations | Monitoring | ITSM | DevOps | Cloud

APM

The latest News and Information on Application Performance Monitoring and related technologies.

Application Performance Redefined: Meet the New SignalFx Microservices APM

Today, Splunk announced a new milestone release of SignalFx Microservices APM, introducing groundbreaking innovations including: Full Fidelity tracing, AI-Driven Directed Troubleshooting, and open framework instrumentation. With the Splunk acquisition of SignalFx and Omnition now behind us, we’re excited to announce a new, revolutionary release of SignalFx Microservices APM.

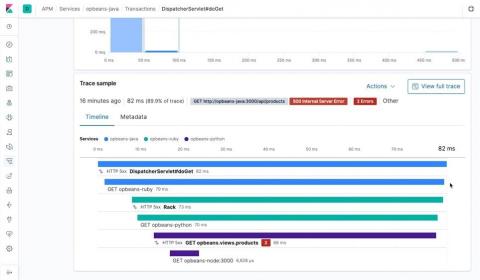
How to instrument a polyglot microservices application with Elastic APM

One of the challenges introduced by microservices architectures is the ability to understand how the application performs and where most time is spent. The Elastic Stack and Elastic APM can provide observability for modern, microservice-based solutions as well as monolithic applications. Application Performance Monitoring (APM) combines different technologies to provide a deep, transparent and holistic view of what each service component is doing, where, when, and for how long.

Elastic APM: Free and open application performance monitoring

Application performance monitoring (APM) is a critical part of a unified observability strategy. APM offers deep insights into application performance and behavior, and organizations depend on it to deliver performant and high-quality digital experiences to their customers — both for keeping a proactive pulse on the health of their applications and for troubleshooting issues.

Azure Monitor (Part 7): Mastering Application Performance Monitoring with Application Insights

In my last post I walked through a brief introduction to Application Insights, and APM tools in general, and hopefully the simple outside-in availability test I concluded the chapter with has been a useful starting point for you on your APM journey. In this post, I’m going to dig deeper into Application Insights and walk you through a use case that should make the purpose of Application Insights really clear.

Dissecting Customer Experience

With all the buzz surrounding user experience these days, I thought it might be worthwhile to start “at 50,000 feet” and dissect user experience into its component parts and see what all the fuss is about. User experience (UX) is somewhat different than customer experience (CX). Customer experience has been defined as the quality of all a consumer’s encounters with a company’s products, services, and brand. Today, user experience typically refers to the digital user experience.

Elastic APM adopts W3C TraceContext

Distributed tracing remains one of the most important features of any tracing system. Nearly a year ago, we announced Elastic APM distributed tracing, let’s take a look at how this useful feature works behind the scenes. Over the past few years, many applications have adopted microservice architecture. Each of the services in a microservice architecture can have their own instrumentation to provide observability into the service.

From distributed tracing to distributed profiling with Elastic APM

Distributed tracing is great — it helps you identify (micro)services within complex architectures having issues interfering with user experience, such as high latency or errors. But once a problematic service is identified, it can be difficult to find out which methods are to blame for the slowdown. Well, we have some big news to share for our Elastic APM users within the Java ecosystem.