Operations | Monitoring | ITSM | DevOps | Cloud

Analytics

Introducing Custom Parsing on LogDNA: A dead simple way to define your own log parsing rules

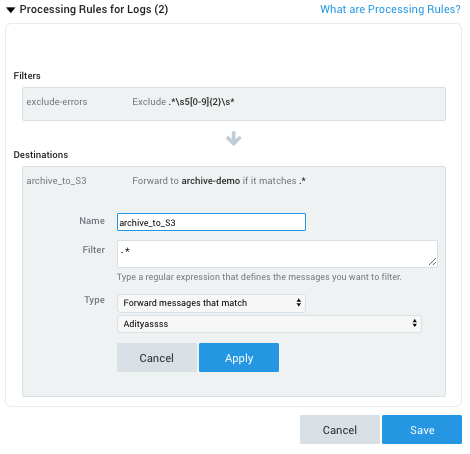
We’re excited to announce that LogDNA’s built-in log parser offers custom parsing, now available in beta. This means you can now use our step-by-step wizard to wrangle non-standard log formats and run custom transformations on your logs, allowing you to easily search and graph log lines that were previously off limits. The best part is, it’s a simple three step process: search, extract, validate… done!

SLF4J: 10 Reasons Why You Should Be Using It

One of the most important aspects of developing an efficient system is to have clean, helpful logs that will help you understand what errors are being triggered, and what information is being processed. When you are first creating an application, you might not know what logging framework will be most suitable for your future needs, or you could simply want your system to remain agnostic regarding the logging implementation to be used.

timeShift(GrafanaBuzz, 1w) Issue 68

The team was busy speaking at events in Europe and the US this week, showing off new Grafana features and talking about what’s to come. Check out the presentation on logging in Grafana below; we’ll share the video once it’s available. Also in this week’s issue we have 2 new plugins to share, and your weekly dose of Grafana related blog articles and videos.

Heatmaps Make Ops Better

In this blog miniseries, I’d like to talk about how to think about doing data analysis “the Honeycomb way.” Welcome to part 1, where I cover what a heatmap is—and how using them can really level up your ability to understand what’s going on with distributed software. Heatmaps are a vital tool for software owners: if you’re going to look at a lot of data, then you need to be able to summarize it without losing detail.