Operations | Monitoring | ITSM | DevOps | Cloud
Speeding Up Security Investigation with Logz.io Threat Intelligence
Cloud, microservices, Kubernetes — all these bleeding-edge technologies revolutionizing the way applications are built and deployed are also a huge security headache. Modern IT environments are increasingly comprised of more and more components and layers, each of generating growing amounts of data. In most organizations, more data is a double-edged sword. On the one hand, it gives teams more visibility into their environment.
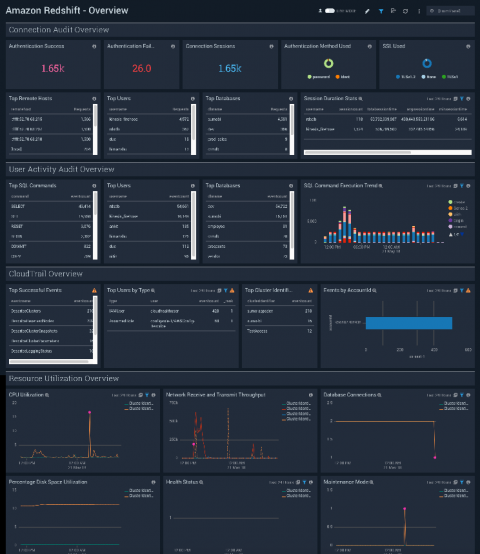
How to Monitor Redshift Logs with Sumo Logic
In the second installment of our Amazon Redshift series, we covered the different ways you can monitor the performance and disk space of your Redshift servers using tools in AWS. In this final post, we will discuss how you can take your monitoring and logging efforts up a couple of notches by using Sumo Logic with Amazon Redshift.
Logging vs Monitoring: How are They Different & Why You Need Both
Logging or monitoring? If you deploy and manage an application, these are the two key techniques available to you for helping to ensure that the application meets availability and performance expectations. One of them is Application Performance Management, or APM, though you can also find it referred to as ‘Application Performance Monitoring’ or simply ‘monitoring’. The other is log analytics and management or just ‘logging’.
How to Monitor AWS CloudTrail Logs with Sumo Logic
This is the third and last in a series of articles on Amazon CloudTrail. In the first part of the series, we introduced AWS CloudTrail and how it works and saw where and how it saves its data. We then learned how to query CloudTrail logs in the second part of the series where we used Amazon Athena to find meaningful information from large volumes of CloudTrail data.
Micro Lesson: Metadata and Keywords
What Is Log Analytics? Find Important Patterns in Your Logs
If your work in IT, especially in the software field, then you’re almost certainly aware of logs. An application that doesn’t generate any type of logging would be unheard of, to say the least. What about “log analytics?” Do you know this term?
Introducing Logz.io on the Azure Marketplace
The Azure Marketplace makes it easy for customers to identify, subscribe to, then use SaaS and API solutions by removing barriers in the procurement process for purchasing those products. By using the existing payment terms they have with Microsoft, Azure customers can click through a simple workflow to purchase an ISV solution without needing to negotiate new terms or speak directly with an Azure or ISV representative.
Business Intelligence and Log management - Opportunities and challenges
Business intelligence (BI) is all about making sense of huge amounts of data to extract meaningful and actionable insights out of it. Log management tools such as Graylog, instead, are the perfect solution to streamline data collection and analysis, so it’s easy to understand how these two technologies can make sense when they’re coupled together.
Replicating and Restoring LogDNA Account Configurations
As an engineer who has set up logging for more than one deployment or environment, you know that you usually have one logging account per deployment. You’ve got plenty of pre-created queries, graphs, and alerts set up specific for your company’s use case, all of which are vital to you knowing the health of your infrastructure. Now imagine being responsible for creating and maintaining logging accounts across 10+ deployments.


