Operations | Monitoring | ITSM | DevOps | Cloud

Analytics

Deleting Production in a Few Easy Steps (and How to Fix It)

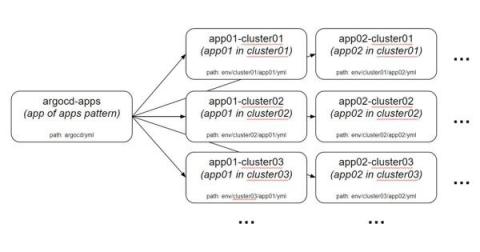
It’s the type of nightmare that leaves developers in a cold sweat. Imagine waking up to a message from your team that simply says, “We lost a cluster,” but it’s not a dream at all. InfluxDB Cloud runs on Kubernetes, a cloud application orchestration platform. We use an automated Continuous Delivery (CD) system to deploy code and configuration changes to production. On a typical workday, the engineering team delivers between 5-15 different changes to production.

Entrepreneurs, CMO's, And All Marketers, Why Small Data Might Drive More Creative Customer Insights Than Big Data

The term ‘big data’ is used so commonly in research and marketing terms, you would think it’s been here forever. But actually, big data evolved from database marketing (read first efforts of targeted direct mail) in the mid to late 1980’s. This was the first attempt of marketing agencies and large corporations to begin segmenting their customer databases to create different offers based on the demographics or psychographics of their customers.

Featured Post

Imagining the Future of Engineering: Insights from top women in tech

This International Women in Engineering Day, the theme is #imaginethefuture. Supporting women in engineering, now and in the future, is vital as it allows us to develop inclusive, innovative solutions for complex issues that can benefit everyone. We have collated the thoughts and opinions of the specific challenges that a number of females across the tech industry have faced, as well as, providing advice for other women looking to break into the industry.

Matplotlib Tutorial - Learn How to Visualize Time Series Data With Matplotlib and InfluxDB

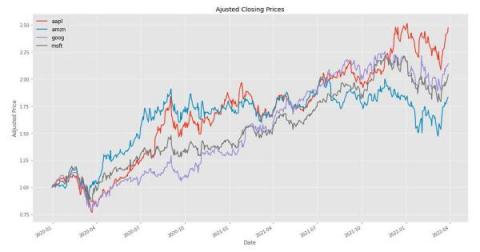
A time series is a sequence of data points (observations) arranged chronologically and spaced equally in time. Some notable examples of time series data are stock prices, a record of annual rainfall, or the number of customers using a bike sharing app daily. Time series data exhibits certain patterns, such as the highs and lows of hotel prices depending on season.

How IT Operations can demonstrate business value with Unified Analytics

As an IT Ops exec, imagine your jubilation upon learning that after a year of hard work across your NOC, DevOps and SRE teams, you are able to automate incident response by 25%. You’re elated as you enter your CTO’s office to share this information, and their response is.

Multicloud Cost Management

More enterprises are adopting cloud computing to ensure that they can accelerate innovation, stay competitive, and enjoy cost savings. This trend has only increased in the last two years with the rise of remote work necessitated by the COVID-19 pandemic. With the rise of cloud adoption, multi-cloud and hybrid cloud deployments are increasing in popularity as well. According to a Gartner survey, 81% of survey respondents are using two or more cloud providers.

Getting Started with OpenTelemetry for Observability

This article was published in The New Stack. For most developers, software development means there is an API for almost everything, hardware is provisioned via the cloud and the core focus is on building only the features most crucial to your business. Of course, all these integrations and modern distributed architectures create their own set of problems. Having full insight into your application has become even more important and is now commonly known as observability.