We help you find and fix issues with your cloud apps fast. Exoprise is the leading solution provider for monitoring SaaS services like Microsoft 365, Box, Dropbox, Salesforce.com and more.
From databases to servers, communication systems, operating systems and custom applications, NiCE provides the right application monitoring solutions and services.
Monitive is an uptime monitoring service, where users sign up and input their website address, which we check every minute, from a random location around the world, and instantly notify them when their site is down.
EventSentry is an award-winning Hybrid SIEM which features real-time log, system health and network monitoring to proactively monitor networks and preemptively respond to threats.
ManageEngine crafts comprehensive IT management software with a focus on making your job easier. Our 90+ products and free tools cover everything your IT needs, at prices you can afford.
Raygun is a Software Intelligence Platform that gives companies visibility into software problems. Errors, crashes and slow loading pages and scripts affecting end users are automatically detected, enabling teams to build excellent user experiences.
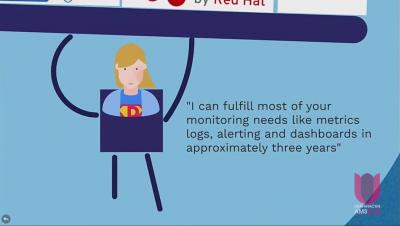
Amgen has been on a journey to confront the multi-million dollar elephant in the room. Technical debt that had been passed down for 10 years in their monitoring portfolio. But how to overcome inertia and a failure to understand how to maximize internal value for data that belongs to organization to begin with?
Monitoring Kubernetes is vital to understanding the health and performance of a cluster, but which metrics are most important to add to your dashboards and alert on? Jacob will discuss how to most effectively monitor and visualize your Kubernetes cluster using the Grafana Kubernetes plugin and PromQL.
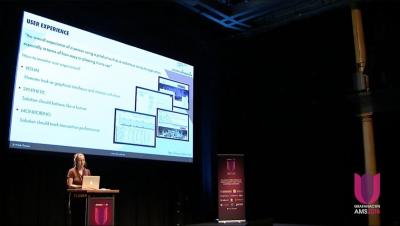
When performance metrics are combined with active user experience and machine learning, we can gain new insights about why a business critical application is slow, what components are involved, and how this impacts users and hardware.
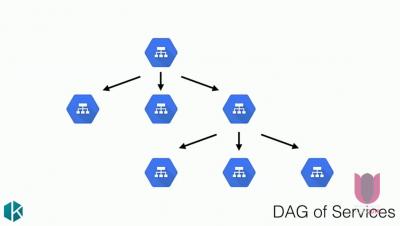
The RED Method defines three key metrics you should measure for every microservice in your architecture. It gives developers a template for instrumenting their services and building dashboards in a consistent, repeatable fashion.
Significant amounts of time have been invested in performance testing and analysis of OpenStack. In this talk I share how we use Grafana and many other Open Source tools to monitor the performance of an OpenStack Cloud while benchmarking.
From zero to Kubernetes: Which challenges do I face while migrating a cloud-unready Java application such as HiveMQ from a classical Linux IT- environment to Docker-Orchestrator Kubernetes?
Each company wants to build the next unicorn. The next Facebook, the next Twitter, the next Quora. But this is rarely what they accomplish. I’ve seen it time and time again.