Operations | Monitoring | ITSM | DevOps | Cloud

Tracing

The latest News and Information on Distributed Tracing and related technologies.

Honeycomb Is All-In on OpenTelemetry

OpenTelemetry (or “OTel”) helps you get your instrumentation started quickly, and it helps you get the most out of that telemetry data by providing flexible exporting options. As a result, it’s emerging as the new standard for instrumentation. To that end, today we’re sharing more insight into the work we’ve done (and are doing) to enable a path for all Honeycomb users toward OTel adoption. We hope you’ll be as excited as we are to embrace these open standards!

Distributed tracing with OpenTelemetry and Cloud Trace

As more services are involved in serving user traffic and completing transactions, how does each service contribute to overall latency? In this episode of Engineering for Reliability, we’ll show how to use distributed tracing to capture the latency of user requests and how long it takes each service in the path to return a response. Watch to learn how to capture latency in distributed applications using OpenTelemetry and analyze it using Cloud Trace.

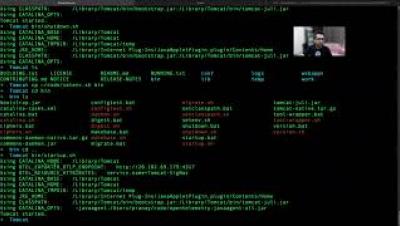
Monitor your Tomcat Java Application in 20 mins with OpenTelemetry & SigNoz

In this video, we show a step by step process to monitor your Spring Boot application with OpenTelemetry. We use SigNoz as the backend and visualisation UI. SigNoz is an open source alternative to DataDog, NewRelic, etc. We natively support Opentelemetry based instrumentation. You can instrument any application written in a language/framework supported by OpenTelemetry and visualise metrics and traces in SigNoz.

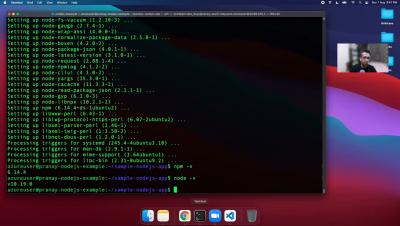
NodeJS application monitoring with OpenTelemetry

In this video, we show a step by step process to monitor your Node JS application with OpenTelemetry. We use SigNoz as the backend and visualisation UI. SigNoz is an open source alternative to DataDog, NewRelic, etc. We natively support Opentelemetry based instrumentation. You can instrument any application written in a language/framework supported by OpenTelemetry and visualise metrics and traces in SigNoz.

Spring Boot - Monitor your application with OpenTelemetry & SigNoz

In this video, we show a step by step process to monitor your Spring Boot application with OpenTelemetry. We use SigNoz as the backend and visualisation UI. SigNoz is an open source alternative to DataDog, NewRelic, etc. We natively support Opentelemetry based instrumentation. You can instrument any application written in a language/framework supported by OpenTelemetry and visualise metrics and traces in SigNoz.

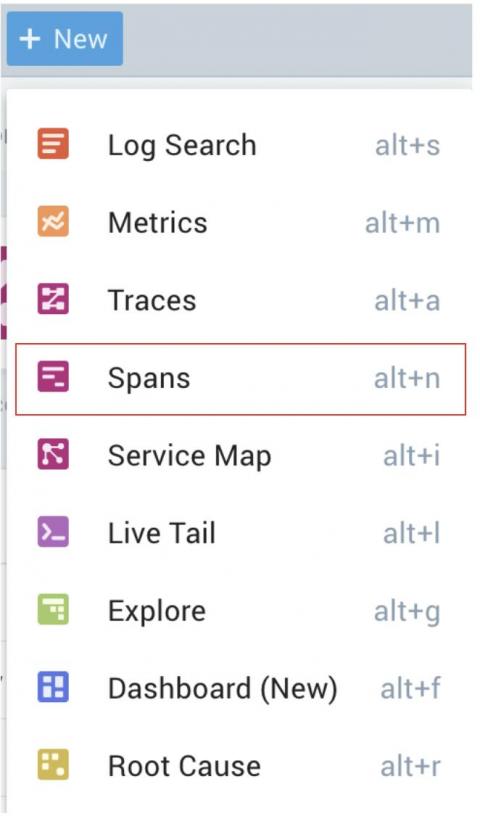
Queryless vs. Query-less. Faster Insights and Better Observer Experience with Span Analytics

In one of my previous blogs I explained how important it is for a modern observability platform to provide “the observers” full, flexible access to all raw telemetry. Observability’s promise to find unknown unknowns relied directly on the ability of fast, powerful and multidimensional high-cardinality analysis of raw data, to uncover previously unknown patterns that have not yet been visualized as a metric, dashboard panel or an alert or anomaly event.

The Ops Agent is now GA and it leverages OpenTelemetry

Running and troubleshooting production services requires deep visibility into your applications and infrastructure. While basic logs and metrics are available out of the box with Google Cloud Compute Engine (GCE), capturing advanced data used to require the installation of both a metrics agent and a logging agent.