Operations | Monitoring | ITSM | DevOps | Cloud

Blog

ML and AI enabled IT Ops: the NOC as a modern cockpit

A common sentiment among our prospects after they see our demo for the first time is: “That’s it? It can’t be that simple!”. The truth is – yes it can be, and it should be. ML and AI should make IT Ops simpler, and a big part of that is usability. If your ML & AI powered IT Ops tools take months to set up and weeks to learn, and then don’t provide a substantially improved user experience, you’re obviously using the wrong tools.

OnPage's New Integration With ServiceNow

If you’re an IT professional who has followed our blog, you’re familiar with OnPage and ServiceNow’s integration and their shared commitment to ensuring that critical alerts are never missed. But, did you know that OnPage and ServiceNow just took this powerful integration to the next level? The latest release of the integration provides significant enhancements. It’s also fully certified by ServiceNow and available on the ServiceNow Store.

Pros & Cons of Streaming Media on a Website

Media streaming is becoming popular in our time, thanks to the advancements in technology. A lot has changed, and so has the number of websites that provide these services. Just like any other technology-inspired venture, there are some upsides and downsides of streaming media on a website. Clear Sound and Picture Unlike pirated sites, the video and audio quality of the movies are usually high. You will be streaming the videos in HD.

NiCE Oracle Management Pack 5.00

Oracle database availability and performance is key. Gain insight into what happens within your Oracle environment. Using the NiCE Oracle Management Pack for Microsoft SCOM, advanced monitoring has never been easier. The NiCE Oracle Management Pack smart algorithm determines problems and their severity way upfront. Leverage your existing investment, reduce costs, save time and build efficiencies that will last beyond your expectations.

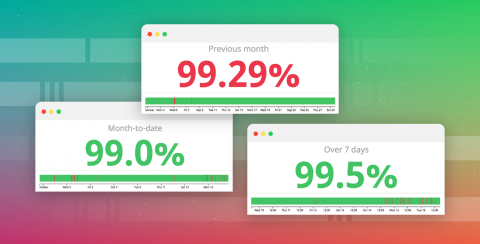
Track the status of your SLOs with the new monitor uptime and SLO widget

Service level objectives are an important tool for maintaining application performance, ensuring a consistent customer experience, and setting expectations about service performance for both internal and external users. We are very pleased to announce the availability of a new monitor uptime and SLO widget that makes it simple to monitor the status of your SLOs and communicate that status to your teams, executives, or external customers.

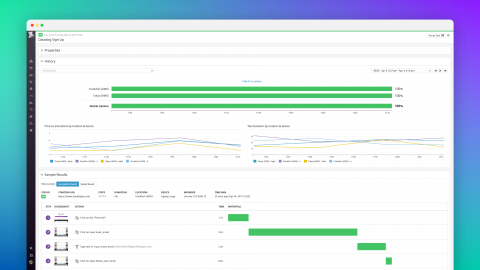
User experience monitoring with Datadog browser tests

Datadog’s new automated browser tests enable you to automate your user experience monitoring and ensure that your users can complete actions like signing up for a new account or adding items to a cart. Anyone on your team can record and automate multistep browser tests in minutes. Once you create a test, Datadog uses machine learning to detect changes to your application and automatically update your tests accordingly.

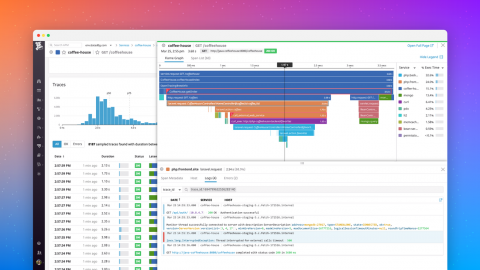
Correlate request logs with traces automatically

When your users are encountering errors or high latency in your application, drilling down to view the logs from a problematic request can reveal exactly what went wrong. By pulling together all the logs pertaining to a given request, you can see in rich detail how it was handled from beginning to end so you can quickly diagnose the issue.

Monitor AIX with the Datadog Unix Agent

Even in an era where container, serverless, and cloud-computing technologies garner considerable attention, many companies continue to run a sizeable share of their mission-critical applications on highly resilient, fault-tolerant systems such as IBM AIX on Power-series hardware. AIX, one of the most popular Unix-based operating systems, is trusted by large companies that process critical data such as medical health records and banking transactions.

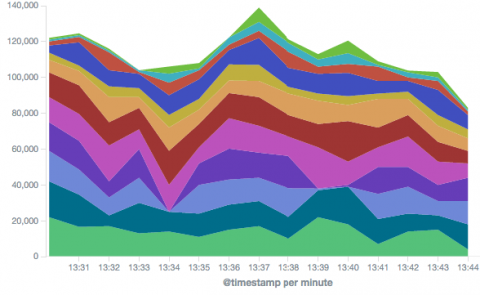
How to Install the ELK Stack on AWS: A Step-By-Step Guide

The ELK Stack is a great open-source stack for log aggregation and analytics. It stands for Elasticsearch (a NoSQL database and search server), Logstash (a log shipping and parsing service), and Kibana (a web interface that connects users with the Elasticsearch database and enables visualization and search options for system operation users). With a large open-source community, ELK has become quite popular, and it is a pleasure to work with.

Why Is Troubleshooting "Citrix is Slow" So Hard?

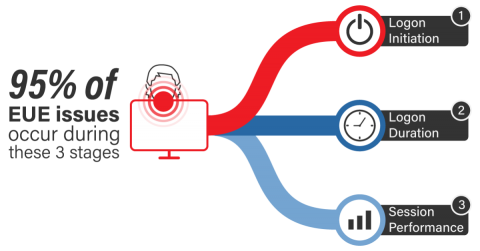
“Citrix is slow” is one of the most common complaints Citrix admins hear on a daily basis. Somewhat ironically, Citrix itself is rarely the problem and the actual cause of the Citrix slow performance issues lies elsewhere. This can make troubleshooting “Citrix is slow” issues extraordinarily difficult to do.