Operations | Monitoring | ITSM | DevOps | Cloud

Blog

Happy National IT Service Provider Day: Celebrating the unsung heroes

Have you ever wondered how your favorite online store stays operational 24/7, or how your company seamlessly connects employees across the globe? The secret behind these smoothly running digital experiences often lies with a dedicated group: IT service providers. Today, on National IT Service Provider Day, we celebrate these unsung heroes who keep the wheels of our digital world turning. They tackle a multitude of challenges to ensure businesses operate efficiently and securely.

Announcing AI Error Resolution

After months of anticipation (and invaluable input from our beta testers!) we’re so excited to officially share AI Error Resolution. We can say firsthand that this tool helps developers resolve issues with renewed speed and accuracy, using AI-powered suggestions on the root cause of errors and how to fix them. Testing has shown how effectively this feature can pinpoint the source of an error and produce the most efficient method to resolve it, accelerating the entire debugging process.

Open-source Telemetry Pipelines: An Overview

Imagine a well-designed plumbing system with pipes carrying water from a well, a reservoir, and an underground storage tank to various rooms in your house. It will have valves, pumps, and filters to ensure the water is of good quality and is supplied with adequate pressure. It will also have pressure gauges installed at some key points to monitor whether the system is functioning efficiently. From time to time, you will check pressure, water purity, and if there are any issues across the system.

Every second counts in our UI

Downtime has always been shown in minutes, hours, and days but for shorter downtimes you would see "0m" even if the actual downtime was less than a minute. We've updated the UI to show downtime in seconds. This means no more manually calculating brief outages — you’ll see exactly how long the system was down :) Did you know you can add notes to downtime periods?

Jaeger vs Tempo - key features, differences, and alternatives

Both Grafana Tempo and Jaeger are tools aimed at distributed tracing for microservice architecture. Jaeger was released as an open-source project by Uber in 2015, while Tempo is a newer product announced in October 2020. Jaeger is a popular open-source tool that graduated as a project from Cloud Native Computing Foundation. Grafana Tempo is a high-volume distributed tracing tool deeply integrated with other open-source tools like Prometheus and Loki.

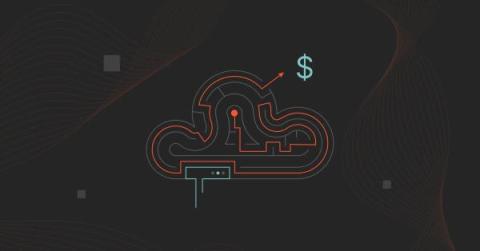
How To Master Cost Efficiency In Serverless Computing

Serverless architectures have revolutionized how businesses deploy applications, offering scalability and cost efficiency by abstracting infrastructure management. This model, charging only for resources consumed, poses unique budgeting and cost optimization challenges due to its variable pricing structure. Navigating cloud costs in a serverless environment requires a nuanced understanding of leveraging this technology’s benefit while effectively managing expenses.

How to Monitor & Identify Google Meet Performance Issues

Virtual meetings have become essential for businesses, connecting teams and enabling collaboration from anywhere. Google Meet has been a reliable platform for these meetings, but ensuring smooth performance requires some know-how. In this article, we'll break down how to monitor and identify Google Meet performance issues. Whether you're an IT professional, network admin, or remote user, this guide is tailored to help you optimize your virtual meetings.

Data Center Energy Consumption Trends of 2024

Data centers are the backbone of our increasingly interconnected world. They power everything from streaming services to AI, handling vast amounts of data every second. However, this technological advancement comes at a cost, with energy consumption being a significant concern. In fact, data center energy consumption is forecasted to double by 2026. As we venture further into 2024, it is important to review some of the key trends around energy consumption in data centers.

Revealing unknowns in your tracing data with inferred spans in OpenTelemetry

In the complex world of microservices and distributed systems, achieving transparency and understanding the intricacies and inefficiencies of service interactions and request flows has become a paramount challenge. Distributed tracing is essential in understanding distributed systems. But distributed tracing, whether manually applied or auto-instrumented, is usually rather coarse-grained.