Operations | Monitoring | ITSM | DevOps | Cloud

Dashboards

How to monitor an xDSL Modem using a Prometheus Exporter plugin and Grafana Agent on Grafana Cloud with Grafana OnCall

Furkan Türkal likes to design and implement new tech stacks with a deep focus on distributed and low-level systems. He is interested in contributing to open source projects, communities, and project management, and has a strong interest in the CNCF world! Recently, he has been doing research on Supply Chain Security. Hardware breaks, just like our hearts — and both can be due to complicated situations.

How to migrate existing Grafana dashboards and alerts into Kubernetes Monitoring in Grafana Cloud

Kubernetes Monitoring in Grafana Cloud is already an observability Swiss Army knife: You can monitor your Kubernetes fleet performance, nodes, pod logs, resource utilization, and overall infrastructure health all in one hosted platform that comes with prebuilt Grafana dashboards to visualize all the important telemetry you need. All of this sounds great … but what if you already have Grafana dashboards and alerts that are custom to your fleet and the way you do business?

Metrics vs. Logs vs. Traces (vs. Profiles)

In software observability, we often talk about three signal types - metrics, logs, and distributed traces. More recently I've been hearing about profiles as another signal type. In this article I will explain the different observability signals and when to use them in a clear and concise way.

Pyroscope and Grafana Phlare join together to accelerate adoption of continuous profiling, the next pillar of observability

We are happy to announce that Pyroscope, the company behind the eponymous open source continuous profiling project, is now part of Grafana Labs. With this acquisition, we will be merging the Pyroscope project and Grafana Phlare, the project we launched last year, under the new name Grafana Pyroscope. We first met the Pyroscope team, led by co-founders Ryan Perry and Dmitry Filimonov, as they were graduating from Y Combinator. Like Grafana Labs, they have open source in their DNA.

Protect PII and add geolocation data: Monitoring legacy systems with Grafana

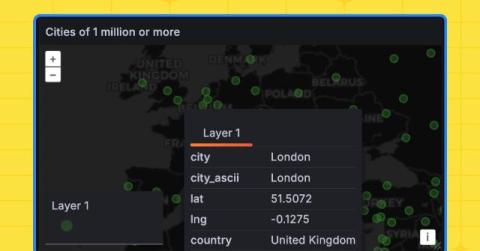
Legacy systems often present a challenge when you try to integrate them with modern monitoring tools, especially when they generate log files that contain personally identifiable information (PII) and IP addresses. Thankfully, Grafana Cloud, which is built to work with modern observability tools and data sources, makes it easy to monitor your legacy environments too.

From Kubernetes Out Of Kubernetes Observability and Shifting left chaos testing

From Kubernetes Out Of Kubernetes Observability (45m) Description: Now that the industry is moving towards extending Kubernetes to manage more and more of the infrastructure, services, and applications running outside Kubernetes itself, it is becoming obvious that we need to have a holistic view of the entire system. We need control planes that will provide not only management but also observability to the whole system. This talk will discuss the concepts of control planes and data planes, how they are used to manage the lifecycle of infrastructure, applications, and services, and how we can apply observability to such resources.

Grafana Agent v0.32 release: New integrations with Oracle, AWS, Microsoft Azure, and more

Grafana Agent v0.32 is now available! This release includes a host of new integrations for the Grafana Agent and components for Grafana Agent Flow so you can easily monitor your vital infrastructure. We’re also excited to announce that Flow is no longer in beta. Introduced last fall, Flow is a new configuration mode that makes Grafana Agent easier and more powerful to run.

AWS Fargate monitoring: How to collect serverless logs, metrics, and traces in Grafana

Interoperability — it’s one of the main reasons I joined Grafana Labs. Our “big tent” philosophy helps Grafana work with a wide range of data sources and tools, and it’s why you can use Grafana to address endless use cases and problems. We are best known for the seamless way we correlate metrics, logs, and traces to understand what is happening in the environment, resolve the immediate issue, and address any underlying issues so that it does not happen again.

New in Grafana Cloud: Key improvements to the command palette and navigation experience

A new navigation experience will be rolled out in Grafana Cloud this month, with improvements designed to make Grafana more seamless to use. Along with updates in Grafana’s search and navigation, there is a new enhanced command palette that helps streamline workflows and allows you to move through the platform without even taking your hands off the keyboard.

5 key takeaways from the Grafana Labs Observability Survey 2023

Observability is coming into its own, as SREs and DevOps practitioners increasingly seek to centralize the sprawl of tools and data sources to better manage their workloads and respond to incidents faster — and to save time and money in the process. That was the overarching message from more than 250 observability practitioners who took part in the Grafana Labs’ first ever Observability Survey.