Operations | Monitoring | ITSM | DevOps | Cloud

Dashboards

Pro Tips: How Booking.com Handles Millions of Metrics Per Second with Graphite

More than 1.55 million room nights are reserved on the Booking.com platform every day. It’s a staggering amount of traffic, and not surprisingly, the Amsterdam-based travel e-commerce company has a lot of knowledge to share about handling metrics at scale.

GrafanaCon L.A. Recap: Grafana 6.0, LGTM, and More!

The rest of the city may still have been in a post-Oscars haze, but over 350 monitoring mavens gathered in downtown L.A. bright and early on Feb. 25 to kick off GrafanaCon 2019. The next two days were filled with 40+ talks, including Grafana end user stories from companies like Bloomberg and Tinder.

timeShift(GrafanaBuzz, 1w) Issue 81

TimeShift is back after a few weeks away with a lot of updates to share. Nearly all of the Videos and presentations from GrafanaCon LA are available, so please check them out and let us know what you think. Also, if you hadn’t heard, Grafana v6.0 stable was recently released which has lots of new features and enhancements. Download the latest version v6.0.1 and read about the highlights below.

How New City Energy Is Supporting Sustainability with Grafana

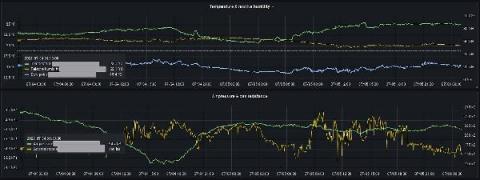
Grafana isn’t just being used for monitoring applications. Andrew Rodgers, Senior Systems Architect at New City Energy, spoke in Amsterdam at GrafanaCon EU 2018 about how his organization is using Grafana to measure energy usage in municipal buildings in Washington D.C. for the Department of General Services (DGS).

Observing Kubernetes: Lessons learned building, managing & monitoring cloud native systems

This talk covers experience and thoughts about how to approach the monitoring and management of cloud-native systems. It will draw both from observations of the opportunities provided by systems like Kubernetes as well as from practical hands-on experience from building real monitoring systems. With luck it will provide both experiences from the past, and inspirations for the future.